Sales Report Samples
-
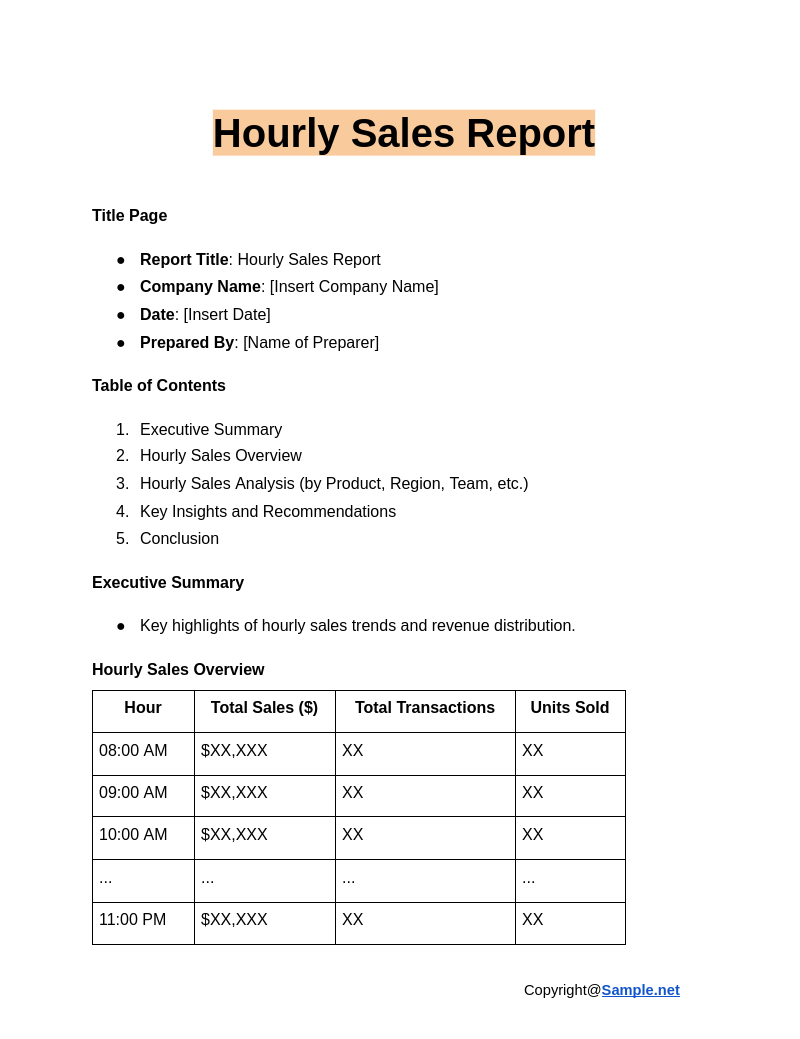
Hourly Sales Report
download now -
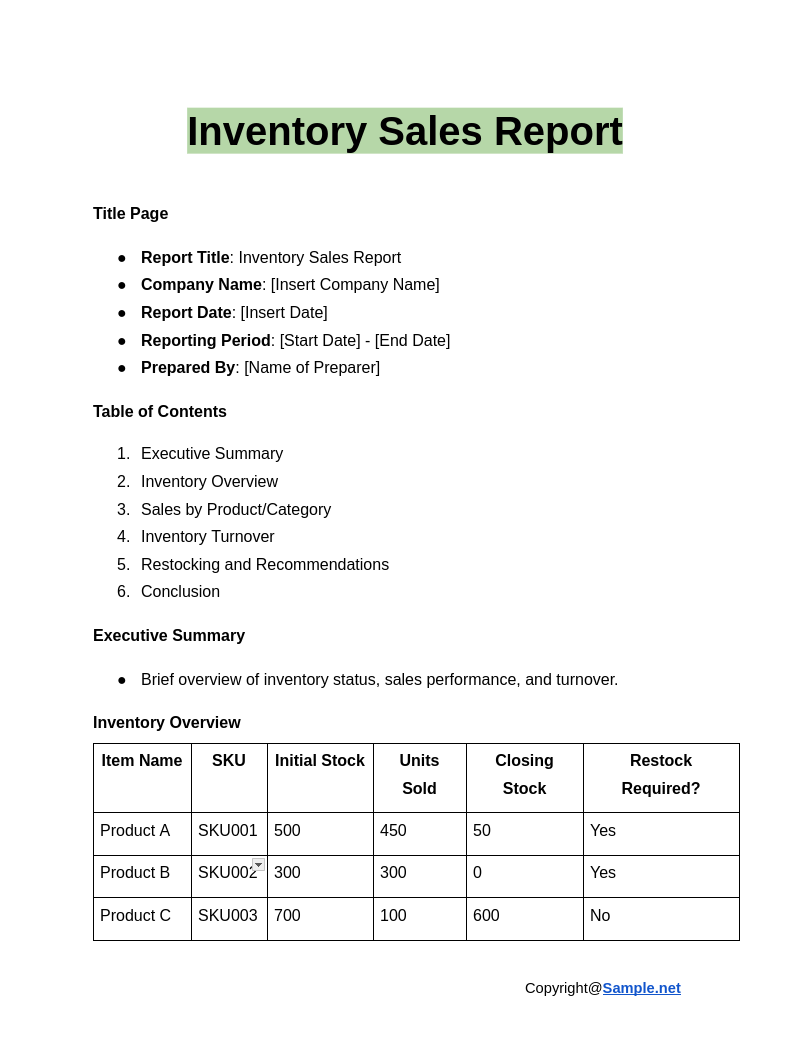
Inventory Sales Report
download now -
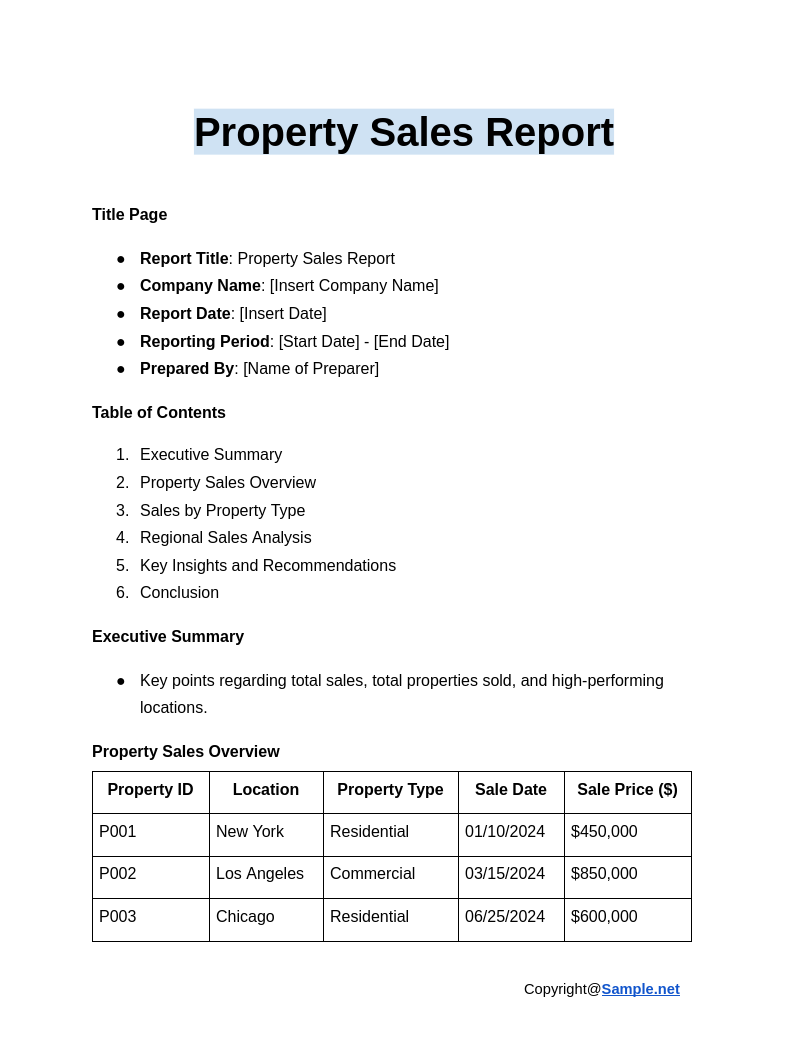
Property Sales Report
download now -
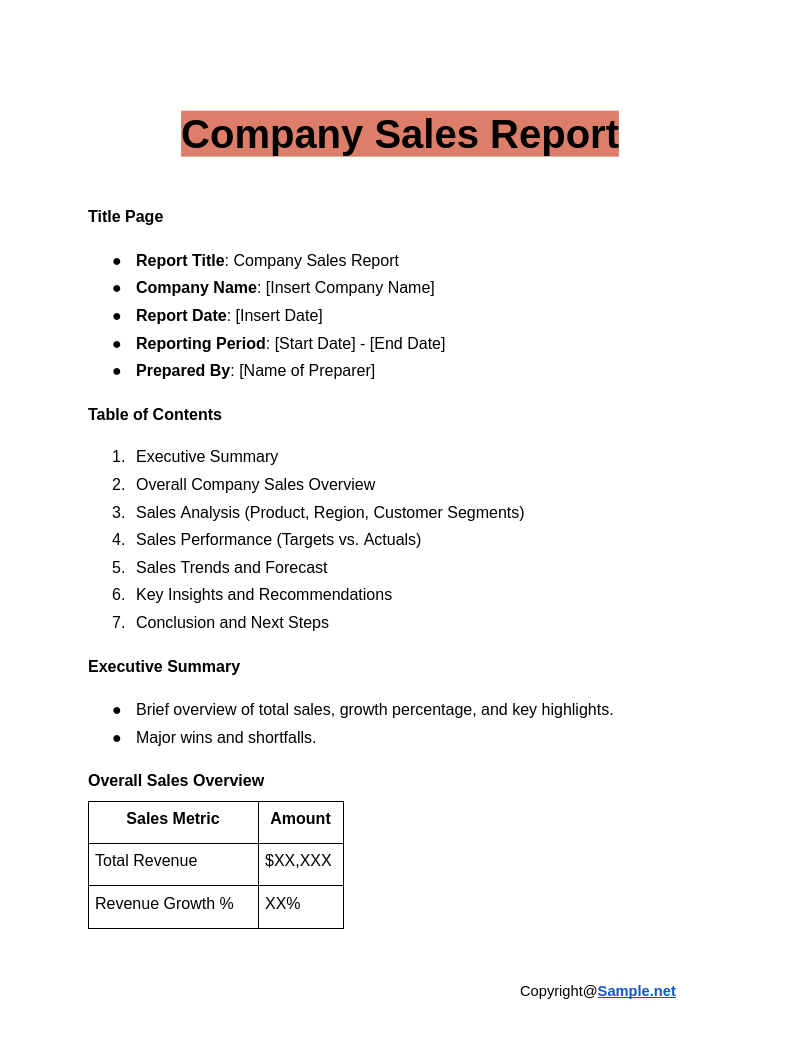
Company Sales Report
download now -
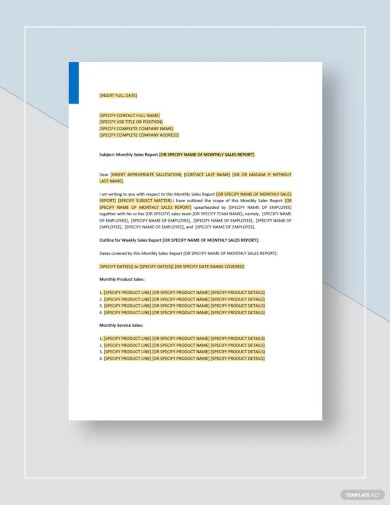
Monthly Sales Report Template
download now -
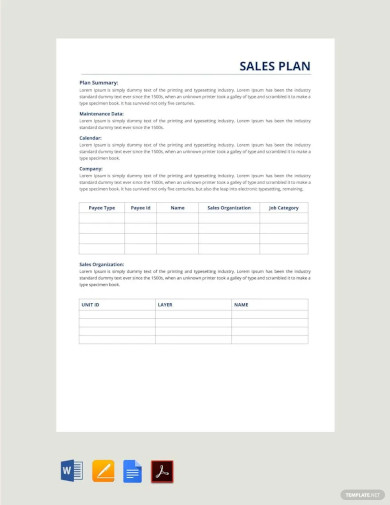
Sales Report Plan Template
download now -
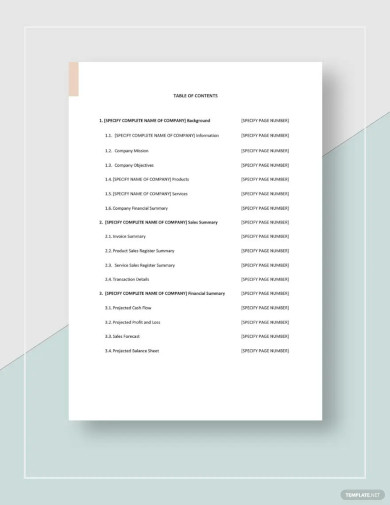
Free Daily Sales Report Template
download now -
Annual Sales Report Template
download now -

Restaurant Monthly Sales Report Template
download now -
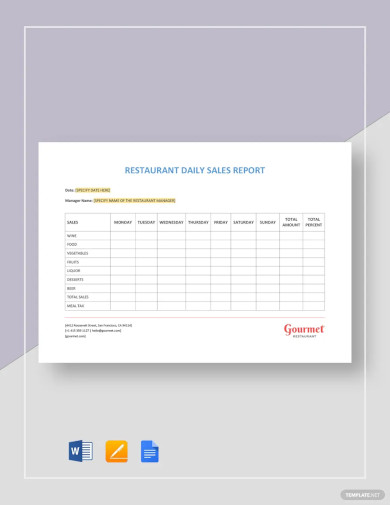
Restaurant Daily Sales Report Template
download now -

Real Estate Sales Report Template
download now -

Sales Report Template
download now -
Free Agency Weekly Sales Report Template
download now -
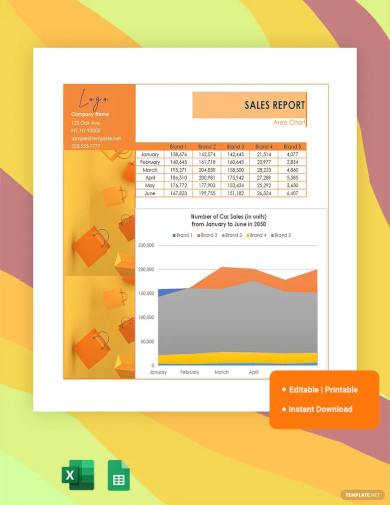
Sales Report Area Chart
download now -
Weekly Sales Report Template
download now -
Sales Trip Report Template
download now -
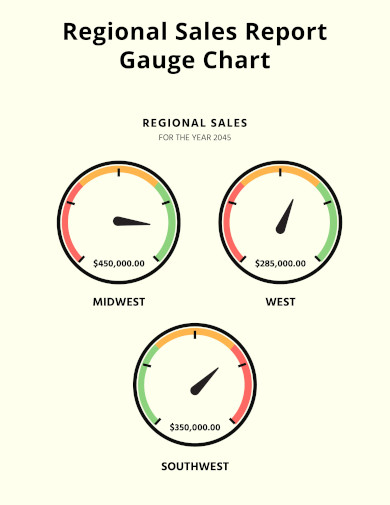
Regional Sales Report Gauge Chart
download now -
Sales Activity Report Template
download now -

Sales Management Report Template
download now -
Sales Call Report Template
download now -
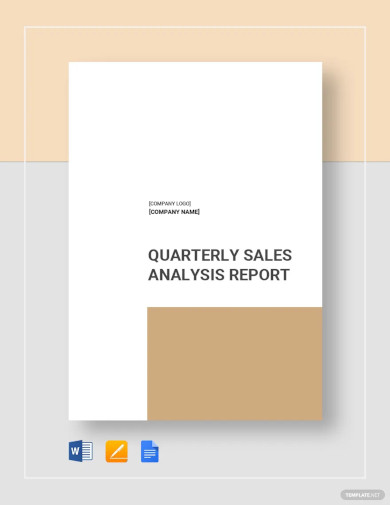
Sales Analysis Report Template
download now -

Annual Sales Report
download now -

Monthly Sales Report
download now -

Daily Sales Report Template
download now -

Standard Weekly Sales Report Template
download now -
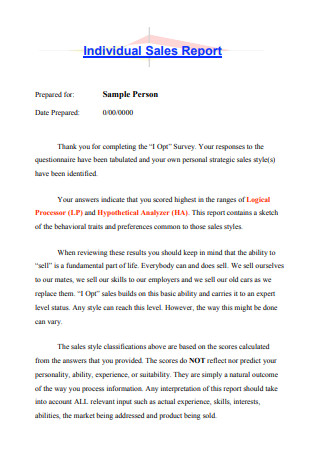
Individual Sales Report
-
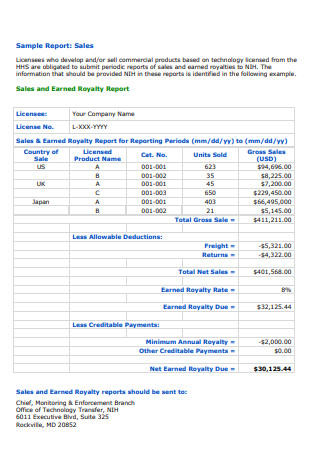
Sample Report Sales
-
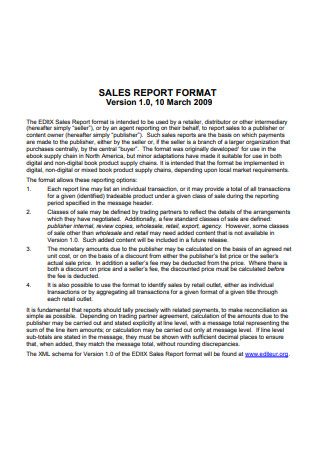
Sales Report Format
-
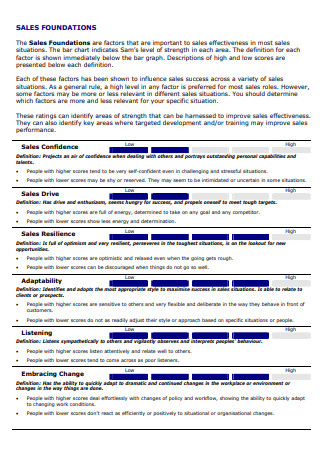
Sales Foundations
-
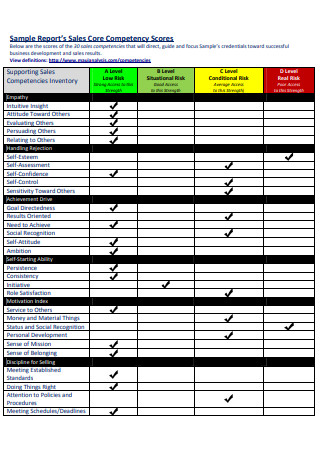
Sample Reports Sales Core Competency Scores
-
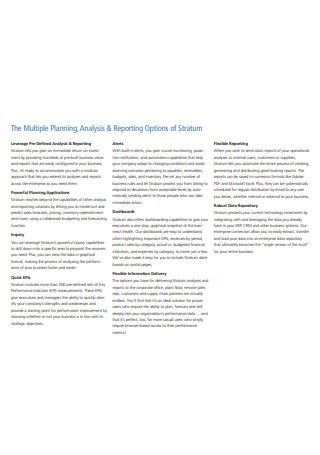
Multiple Planning Analysis Reporting Options of Stratum
-
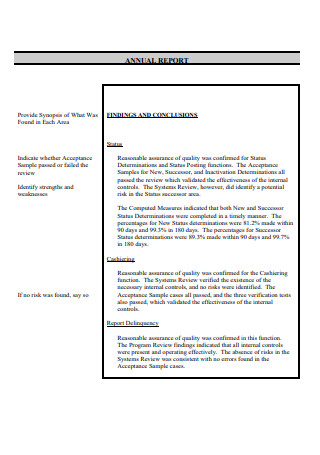
Annual Report
-
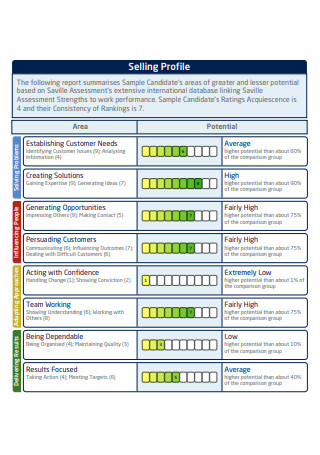
selling Profile Report
-
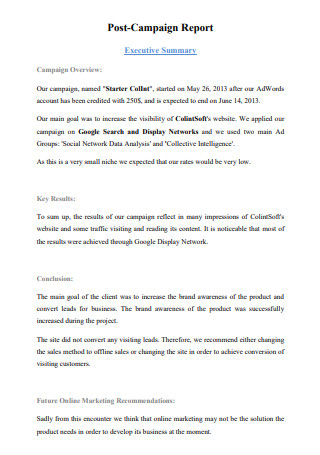
Post Selling Campaign Report
-
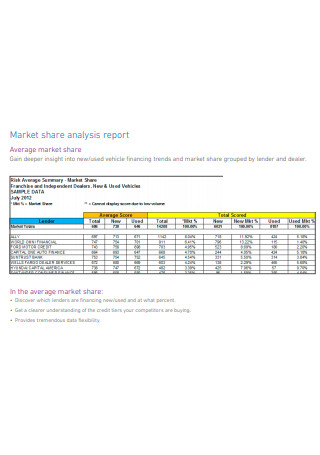
Market share analysis Sale report
-
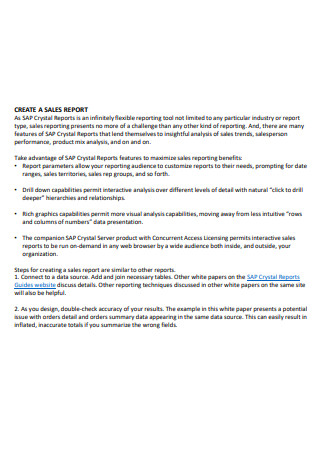
Create Sales Report
-
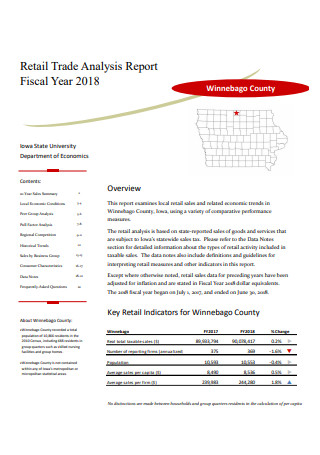
Retail Trade Sales Analysis Report Fiscal Year
-
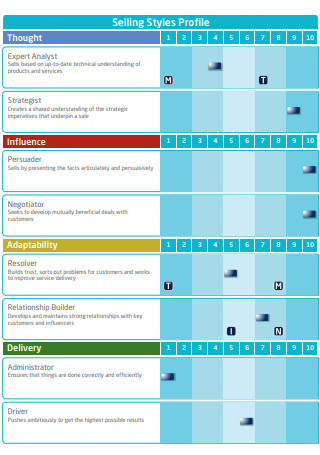
Selling Styles Profile Report
-
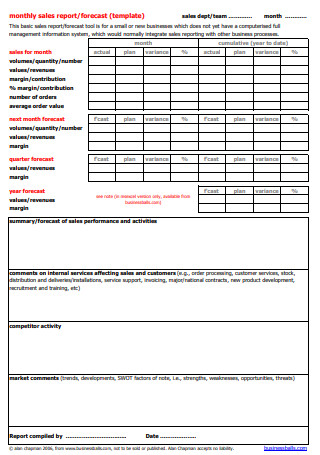
Monthly Sales Report Forecast
-
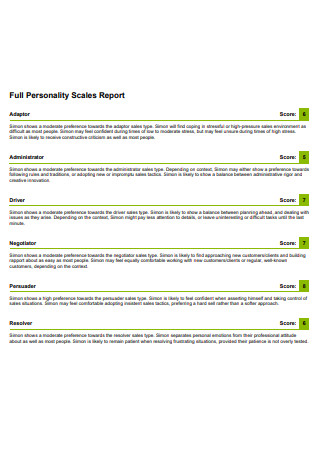
Full Personality Scales Report
-
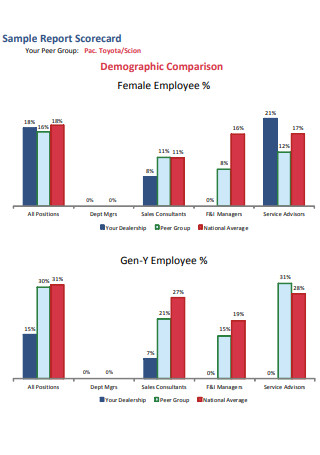
Sample Sales Report Scorecard
-
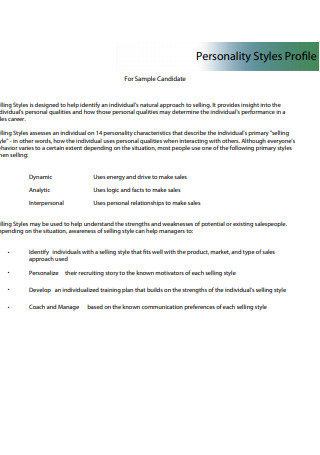
Personality Sales Report Styles Profile
-
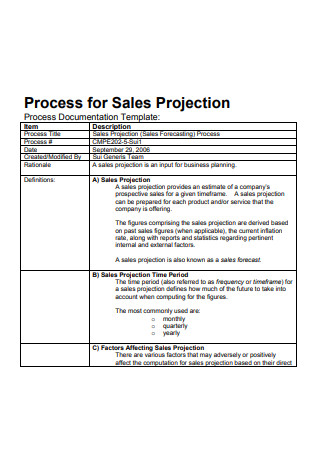
Process for Sales Report Projection
-
California Almond Nursery Sales Report Delayed
-
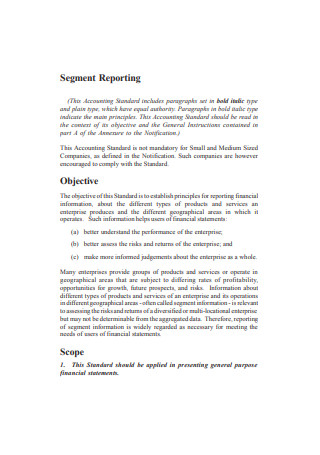
Sales Segment Reporting
-
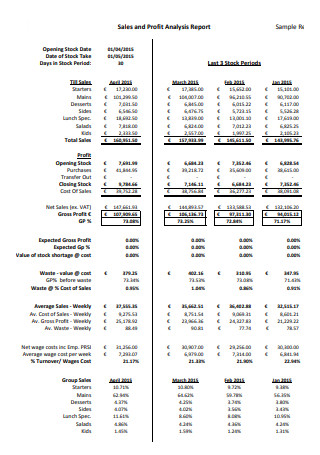
Sales and Profit Analysis Report
-
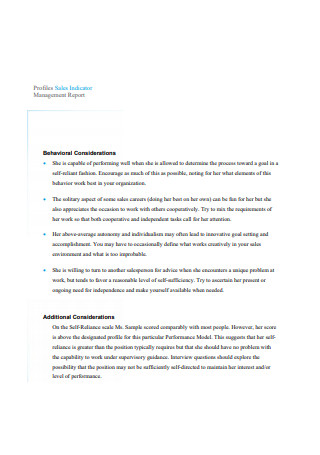
Profiles Sales Indicator Sally Sample Management Report
-
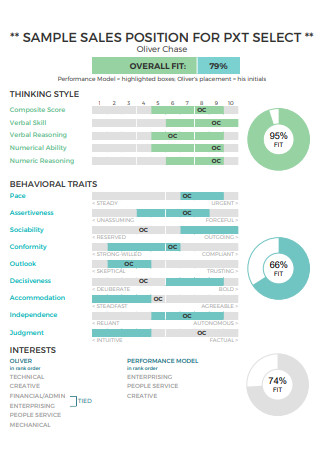
Sales Position For Selection Report
-
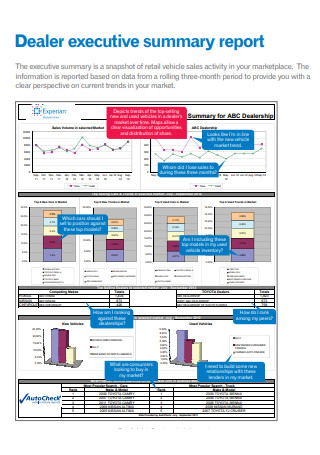
Sales Dealer executive summary report
-
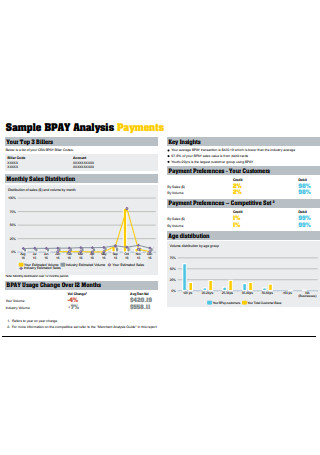
Sample Sales Analysis Payments
-
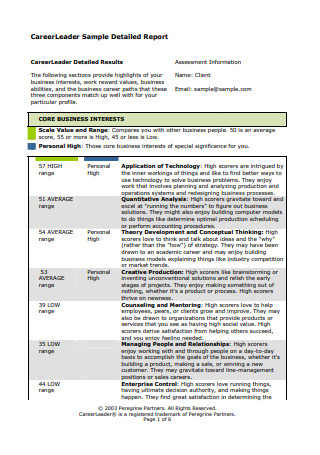
Career Leader Sample Detailed Sales Report
-
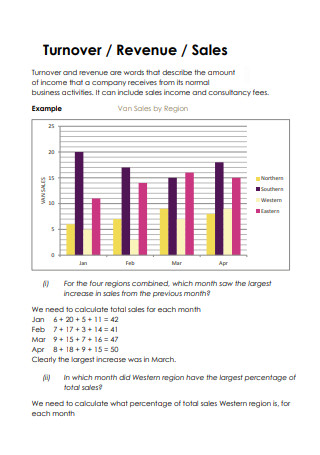
Turnover Revenue Sales Ratio
-
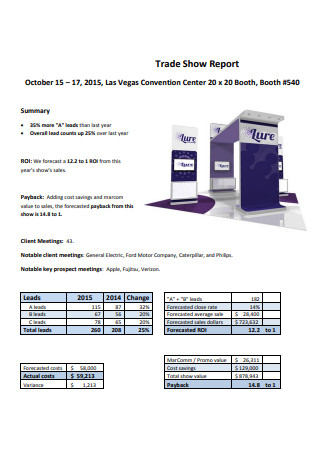
Sales Trade Show Report
-
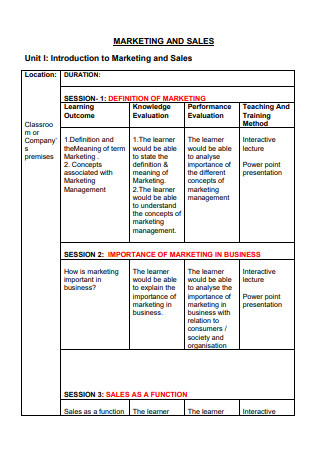
Marketing and Sales
-
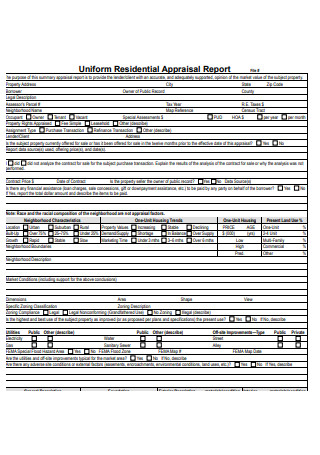
Uniform Residential Appraisal Sales Report File
-
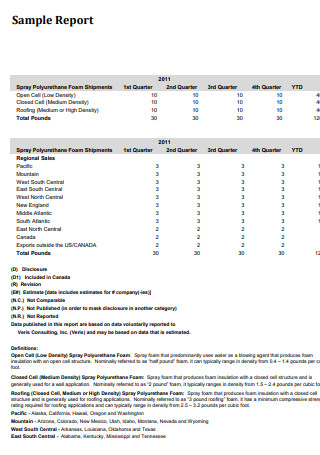
Sample Sales Report
-
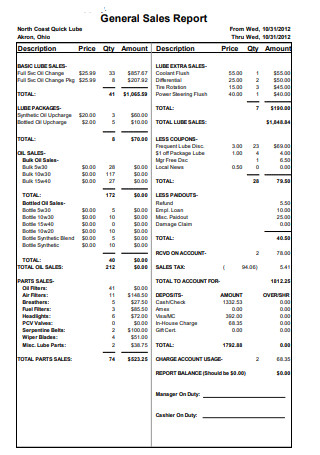
General Sales Report
-
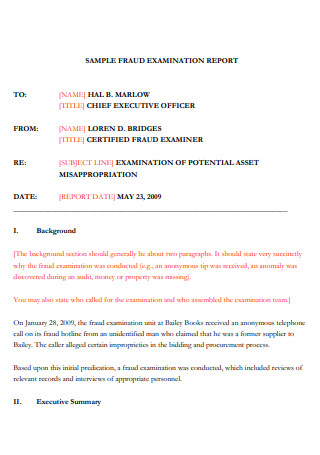
Sample Fraud Examination Report
-
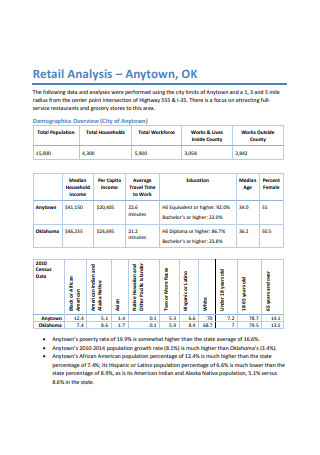
Retail Analysis Sales
-
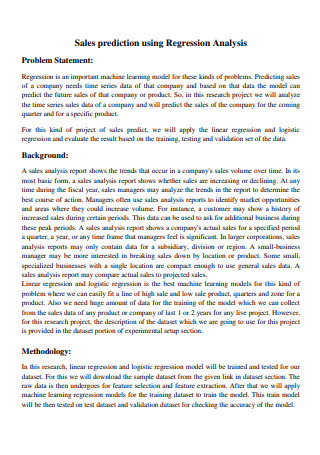
Sales prediction using Regression Analysis
-
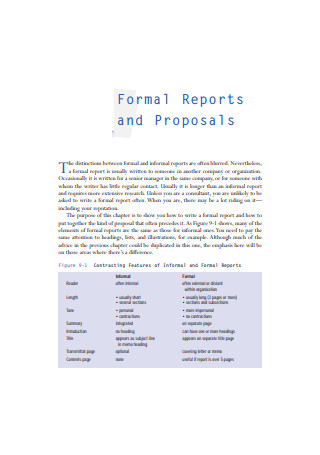
Formal Sales Reports and Proposals
-
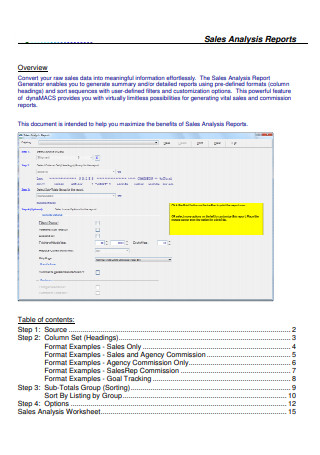
Sales Analysis Reports
-
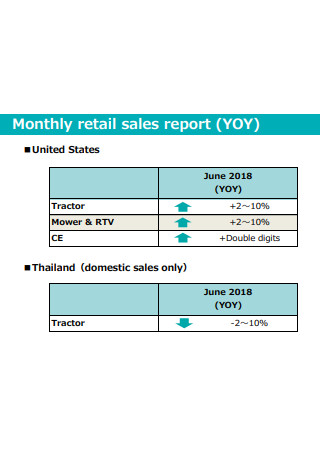
Monthly Retail Sales Report
-
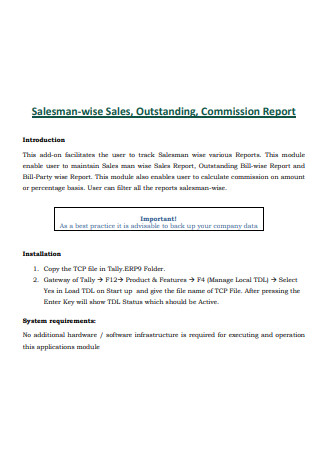
Salesman Wise Sales Outstanding Commission Report
-
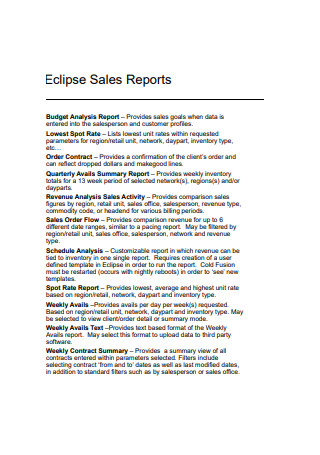
Eclipse Sales Reports
-
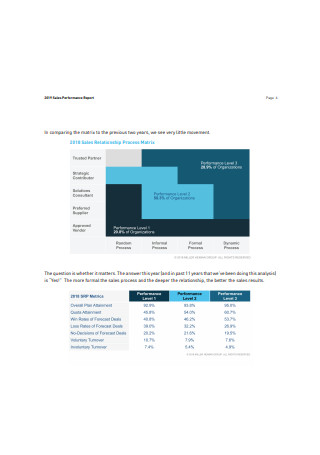
Sales Performance Report
-
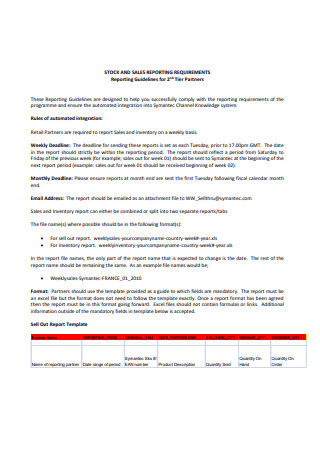
Stock and Sales Reporting Requirements
-
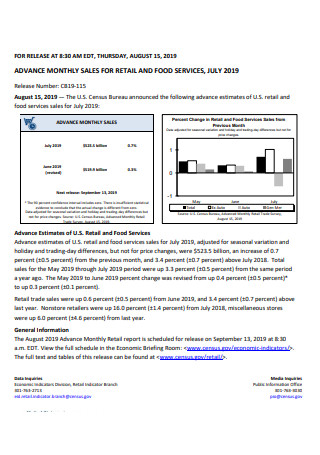
Monthly Sales for Retail and Food Service
-
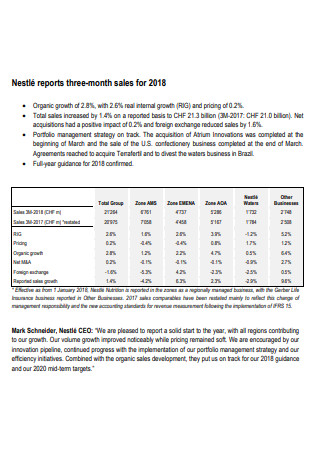
Nestle Reports Three Month Sales
-
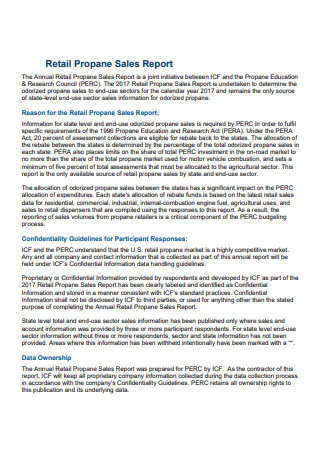
Retail Propane Sales Report
-
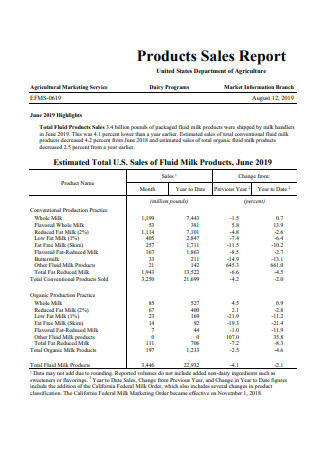
Products Sales Report
-
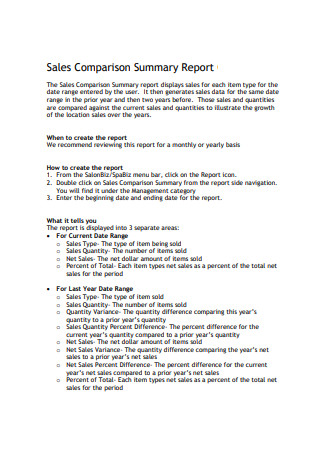
Sales Comparison Summary Report
-
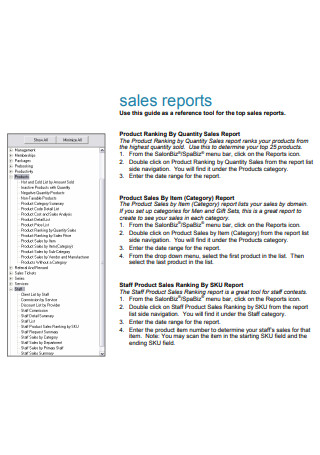
Sales Reports
-
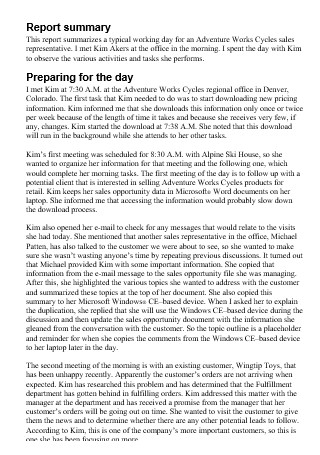
Shadow Report for a Sales Representative
-

Monthly Sales Report
download now
FREE Sales Report s to Download
Sales Report Format
Sales Report Samples
What is a Sales Report?
Types of Sales Reports
How to Create a Sales Report
FAQS
How often should a sales report be created?
How can I identify trends using a sales report?
What are some common mistakes to avoid when creating a sales report?
How can sales reports improve employee performance?
How do product-based sales reports benefit businesses?
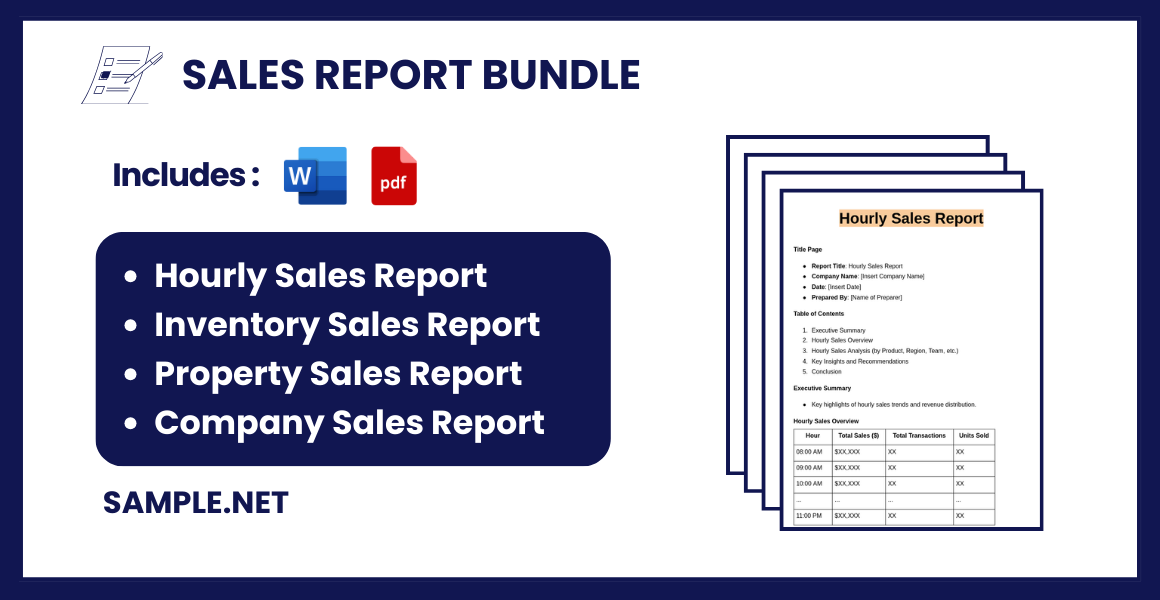
Sales Report Format
1. Title Page
- Report Title: Monthly/Quarterly/Annual Sales Report
- Company Name: [Insert Company Name]
- Report Date: [Insert Date]
- Prepared By: [Insert Preparer’s Name/Designation]
- Period Covered: [Start Date] – [End Date]
2. Table of Contents
- Executive Summary
- Sales Overview
- Sales Analysis (by Product, Region, Team, etc.)
- Sales Performance (Targets vs. Actuals)
- Sales Trends and Forecast
- Key Insights and Recommendations
- Conclusion and Next Steps
3. Executive Summary
- Objective: Highlight the main goals of the report.
- Summary of Results: Brief overview of total revenue, growth percentage, and key highlights.
- Key Findings: Mention major wins, shortfalls, and noteworthy sales activities.
4. Sales Overview
- Total Sales: Revenue generated for the period.
- Sales Growth: Percentage change in sales compared to the previous period.
- Sales by Category: Overview of sales performance by product, service, or customer segment.
| Category | Total Sales | % of Total Sales | Growth % |
|---|---|---|---|
| Product A | $XX,XXX | XX% | XX% |
| Product B | $XX,XXX | XX% | XX% |
| Product C | $XX,XXX | XX% | XX% |
5. Sales Analysis
A. Sales by Product/Service
- Best-Selling Products: List top-performing products.
- Low-Performing Products: List products that underperformed.
B. Sales by Region/Location
- Highlight performance in different regions (e.g., North America, Europe, etc.).
- Use graphs and charts for better visual representation.
| Region | Total Sales | % of Total Sales | Growth % |
|---|---|---|---|
| North America | $XX,XXX | XX% | XX% |
| Europe | $XX,XXX | XX% | XX% |
| Asia | $XX,XXX | XX% | XX% |
C. Sales by Sales Representative/Team
- Track individual or team performance.
- List top-performing salespeople or teams.
| Sales Rep/Team | Target | Achieved | % of Target Met |
|---|---|---|---|
| John Doe | $XX,XXX | $XX,XXX | XX% |
| Jane Smith | $XX,XXX | $XX,XXX | XX% |
| Team A | $XX,XXX | $XX,XXX | XX% |
6. Sales Performance (Targets vs. Actuals)
- Monthly/Quarterly Analysis: Compare sales targets with actual performance.
- Include bar graphs, line charts, or visuals for clear comparison.
| Month/Quarter | Target ($) | Actual ($) | Difference ($) | % Target Met |
|---|---|---|---|---|
| January | $XX,XXX | $XX,XXX | +/–$XX,XXX | XX% |
| February | $XX,XXX | $XX,XXX | +/–$XX,XXX | XX% |
| March | $XX,XXX | $XX,XXX | +/–$XX,XXX | XX% |
7. Sales Trends and Forecast
- Trend Analysis: Discuss patterns seen in sales data (growth, decline, etc.).
- Future Projections: Predict next period’s sales using historical data.
- Market Factors: Highlight factors influencing sales (e.g., economy, seasonality).
8. Key Insights and Recommendations
- Key Insights: Summarize key points from the report.
- Challenges: List sales challenges faced during the period.
- Opportunities: Highlight areas for growth or improvement.
- Actionable Recommendations: Suggest specific next steps for management or the sales team.
9. Conclusion and Next Steps
- Summary: Reiterate the report’s key findings.
- Action Plan: Highlight the top priorities for the next reporting period.
10. Appendices and References
- Data Sources: Mention any external data sources used.
- Supporting Documents: Attach charts, graphs, or detailed breakdowns not in the main report.
What is a Sales Report?
A Sales Report is a document that summarizes a company’s sales activities, tracking revenue, sales volume, and performance metrics over a specific time frame. It highlights essential details, such as best-selling products, customer demographics, and the overall effectiveness of sales strategies. Companies use sales reports to make informed decisions, improve sales performance, and achieve business goals. By reviewing these reports, stakeholders gain insights into key trends, enabling them to optimize marketing strategies and refine operational processes. You can also see more on Sales Summary Report.
Types of Sales Reports
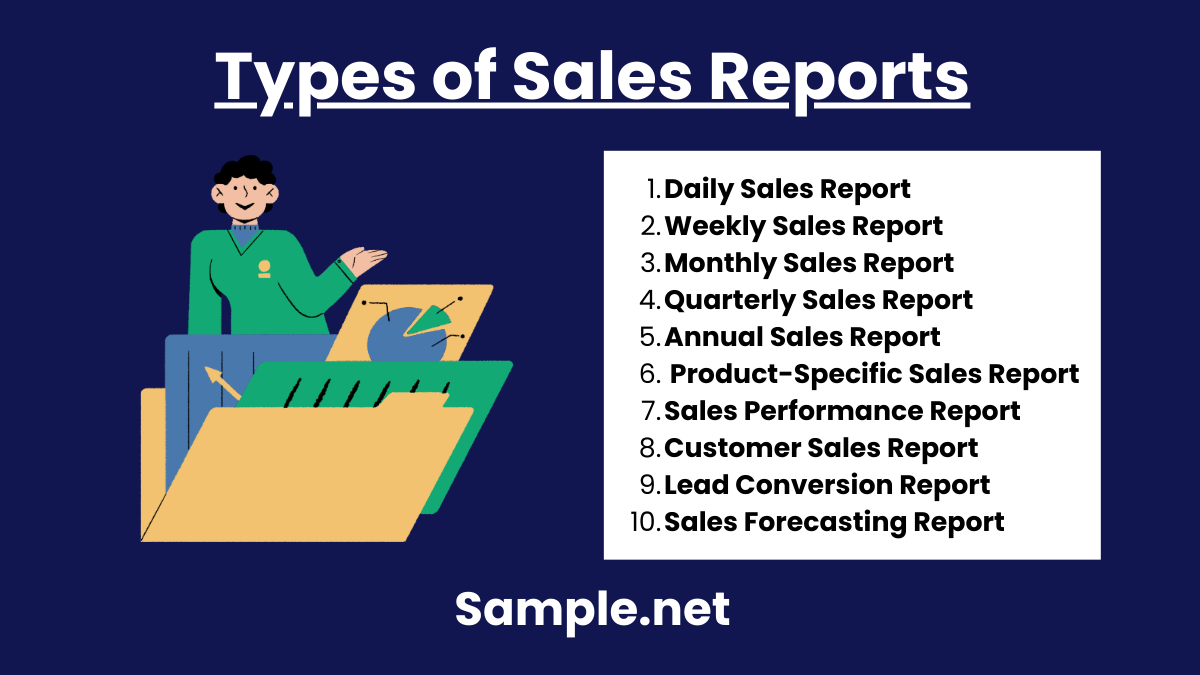
1. Daily Sales Report
A daily sales report provides a snapshot of the sales performance for a specific day. It tracks total sales, revenue, customer visits, and conversion rates. This report helps businesses assess daily performance and make quick adjustments to sales strategies. You can also see more on Quarterly Sales Activity Report.
2. Weekly Sales Report
A weekly sales report summarizes sales activity for the entire week. It includes key performance indicators (KPIs) such as total sales, revenue, best-selling products, and customer trends. It enables sales teams to identify patterns and make informed decisions for the upcoming week.
3. Monthly Sales Report
A monthly sales report gives a comprehensive overview of sales performance for the month. It highlights revenue, profit margins, customer acquisition, and product demand. Businesses use monthly reports to assess growth trends, set goals, and evaluate sales team performance.
4. Quarterly Sales Report
A quarterly sales report is a high-level summary of sales data for a 3-month period. It tracks the company’s financial health, overall revenue, and major growth drivers. This report is crucial for stakeholders, investors, and senior management to assess business performance. You can also see more on Sales Dashboard.
5. Annual Sales Report
An annual sales report offers a complete review of the company’s sales activities over the entire year. It highlights overall revenue, profit, expenses, and key product performance. This report helps organizations measure yearly growth and develop long-term strategic plans.
6. Product-Specific Sales Report
This report focuses on the performance of individual products or product categories. It tracks product demand, sales volume, and customer preferences. Businesses use this report to determine which products to promote, improve, or discontinue.
7. Sales Performance Report
A sales performance report evaluates the performance of individual sales representatives or teams. It tracks metrics such as sales volume, deal closures, and target achievements. Managers use this report to reward high performers and identify areas for improvement.
8. Customer Sales Report
This type of report focuses on customer purchasing behavior. It identifies customer demographics, purchase history, and buying trends. Businesses use customer reports to segment audiences, personalize marketing, and drive customer retention.
9. Lead Conversion Report
A lead conversion report tracks how many leads have been converted into paying customers. It includes data on lead sources, follow-ups, and the length of the conversion process. Businesses use this report to refine marketing and sales strategies. You can also see more on Sales Business Report.
10. Sales Forecasting Report
A sales forecasting report predicts future sales based on past trends and current market conditions. It helps companies set realistic goals, allocate resources, and plan for future growth.
How to Create a Sales Report
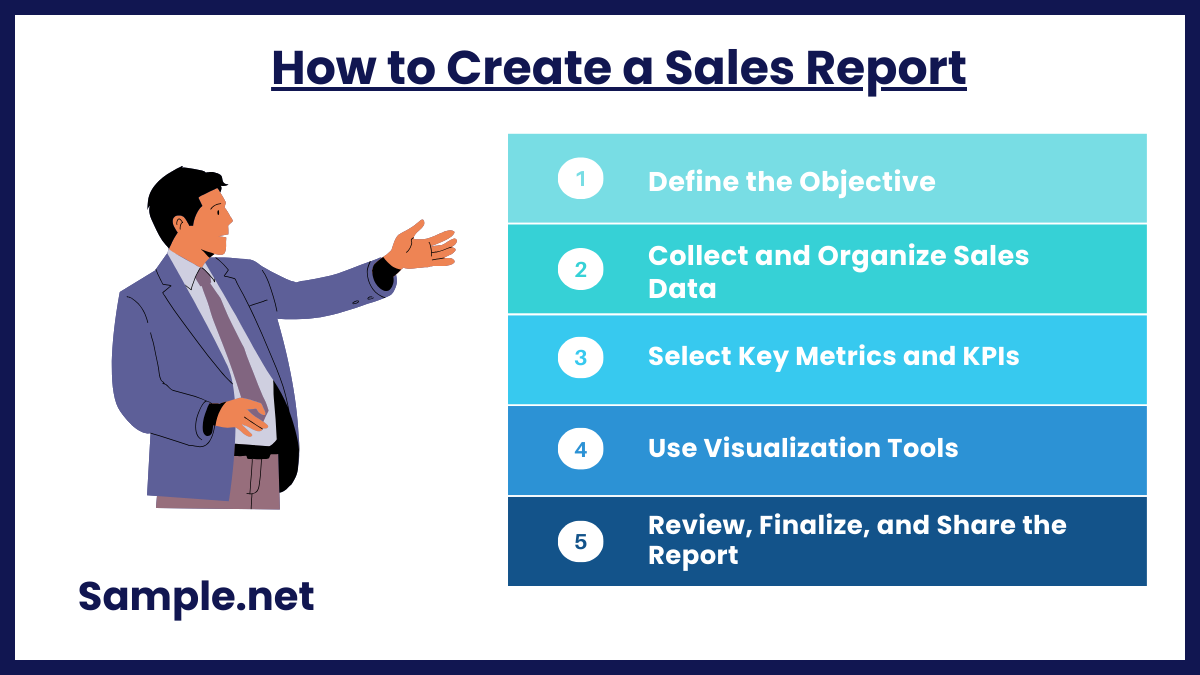
Step 1: Define the Objective
The first step in creating a sales report is to establish its purpose. Determine what information you want to highlight, such as overall revenue, top-performing products, or sales team performance. This will guide the structure and layout of the report. Be clear on the goals to ensure that the report is useful to decision-makers. You can also see more on Monthly Sales Plan.
Step 2: Collect and Organize Sales Data
Gather all relevant data, including sales records, CRM data, and financial documents. Clean and organize this information to eliminate inaccuracies or duplicates. Ensure data accuracy as it directly impacts the report’s credibility. Data should be grouped by product, sales rep, region, or time frame, depending on the report’s objective.
Step 3: Select Key Metrics and KPIs
Decide on the critical performance indicators (KPIs) to include in the report. Metrics like total revenue, sales growth, and product performance are crucial. Choose KPIs that align with your company’s sales objectives. Focus on metrics that offer actionable insights to help stakeholders improve sales performance.
Step 4: Use Visualization Tools
Convert data into visuals like charts, graphs, and tables to make it more understandable. Use tools like Excel, Google Sheets, or reporting software like Tableau. Visual representation allows stakeholders to identify trends quickly. Ensure that visual elements are simple, clear, and not overloaded with information. You can also see more on Sales Performance Evaluation.
Step 5: Review, Finalize, and Share the Report
Before finalizing, review the report for errors, inconsistencies, and omissions. Double-check that all data is accurate and relevant. After verification, format the report for clarity and readability. Once finalized, share it with managers, sales teams, or executives. If needed, provide an explanation or presentation.
A Sales Report is a critical document that helps businesses track revenue, measure growth, and analyze product performance. It allows companies to make data-driven decisions and achieve sales goals. Creating a sales report involves collecting data, selecting key metrics, and using visuals for better comprehension. Businesses use this report to understand market trends, identify revenue opportunities, and strengthen their competitive position. A well-structured sales report empowers stakeholders with insights to drive growth and improve sales strategies.
FAQS
How often should a sales report be created?
Sales reports can be created daily, weekly, or monthly, depending on the organization’s needs. For larger firms, monthly reports are most common. You can also see more on Market Report.
How can I identify trends using a sales report?
Trends can be identified by comparing current data to historical data in the report. Analyzing metrics like month-over-month revenue growth or product sales reveals patterns. Charts, graphs, and visual elements highlight these trends. This helps businesses forecast future sales, plan inventory, and refine marketing strategies.
What are some common mistakes to avoid when creating a sales report?
Common mistakes include using incorrect data, selecting irrelevant metrics, overloading the report with unnecessary details, and using unclear visualizations. To avoid this, focus on key KPIs, ensure data accuracy, and maintain clear, simple graphics. Always review the report before sharing it. You can also see more on Retail Business Report.
How can sales reports improve employee performance?
Sales reports allow managers to track the performance of individual sales team members. By identifying top performers and areas needing improvement, managers can provide targeted coaching and training. Sales goals can be set more clearly, leading to better motivation and accountability.
How do product-based sales reports benefit businesses?
A product-based sales report tracks the performance of each product sold by a business. It highlights top-selling and slow-moving products, enabling inventory optimization. Businesses can discontinue underperforming products and promote popular ones, leading to higher profitability. You can also see more on Lead Management Report.
