Analysis Report Samples
-
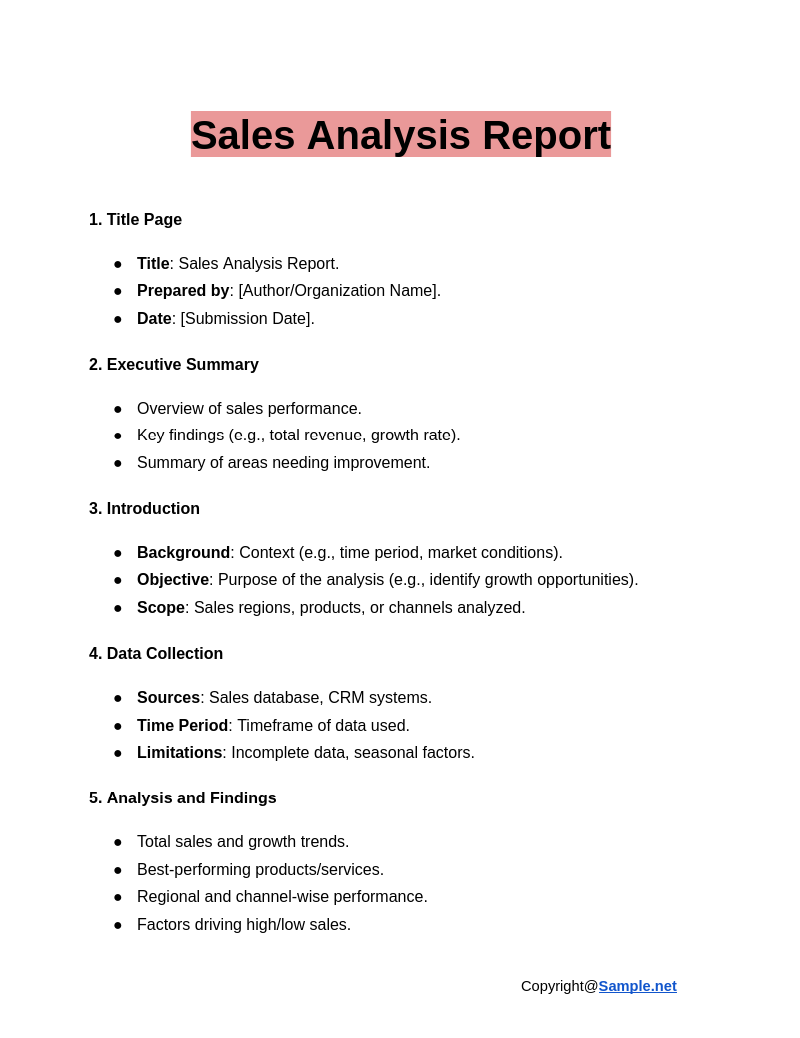
Sales Analysis Report
download now -
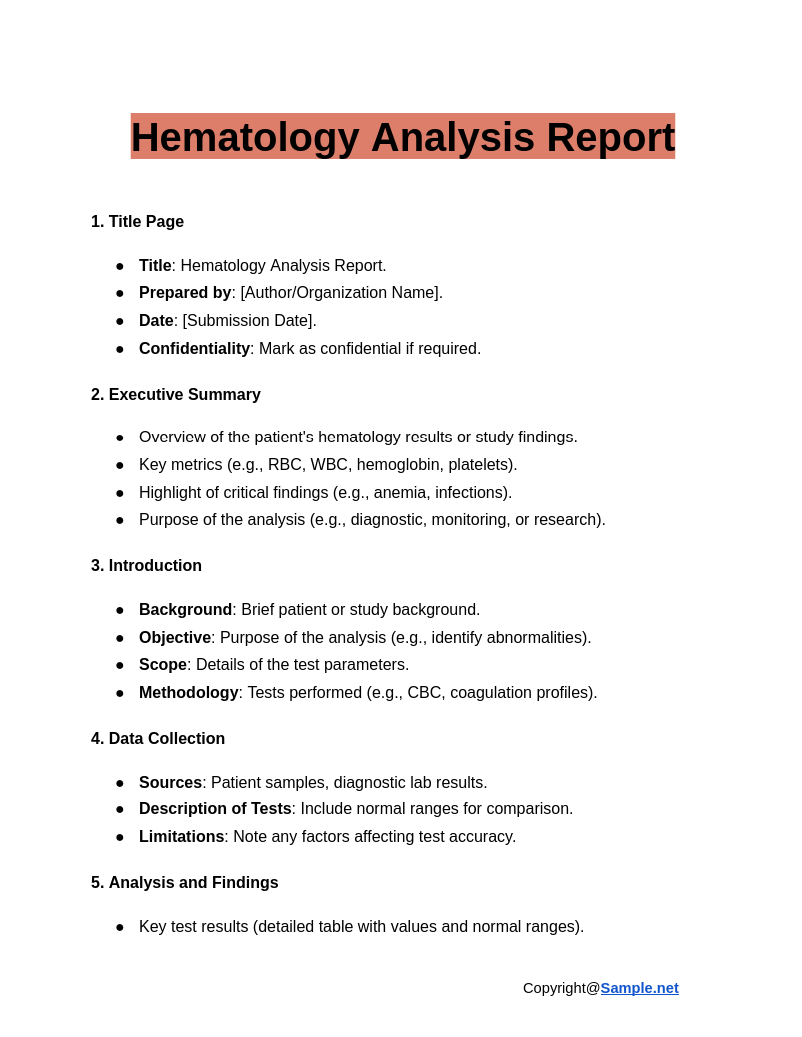
Hematology Analysis Report
download now -
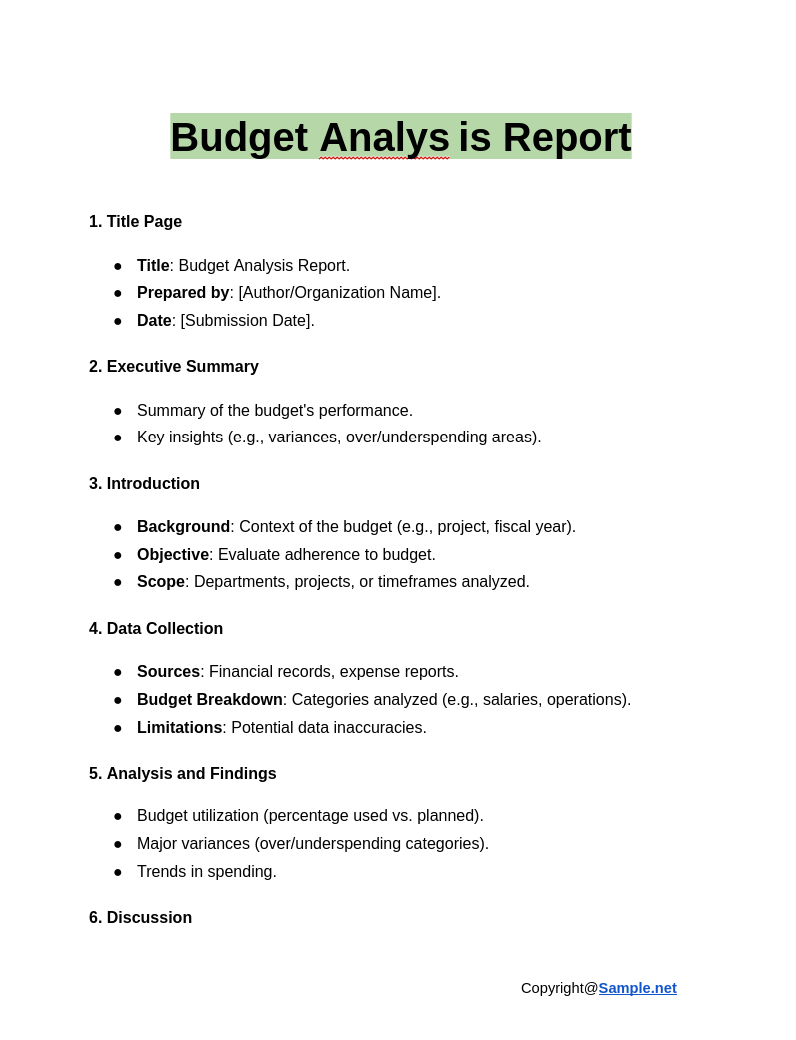
Budget Analysis Report
download now -
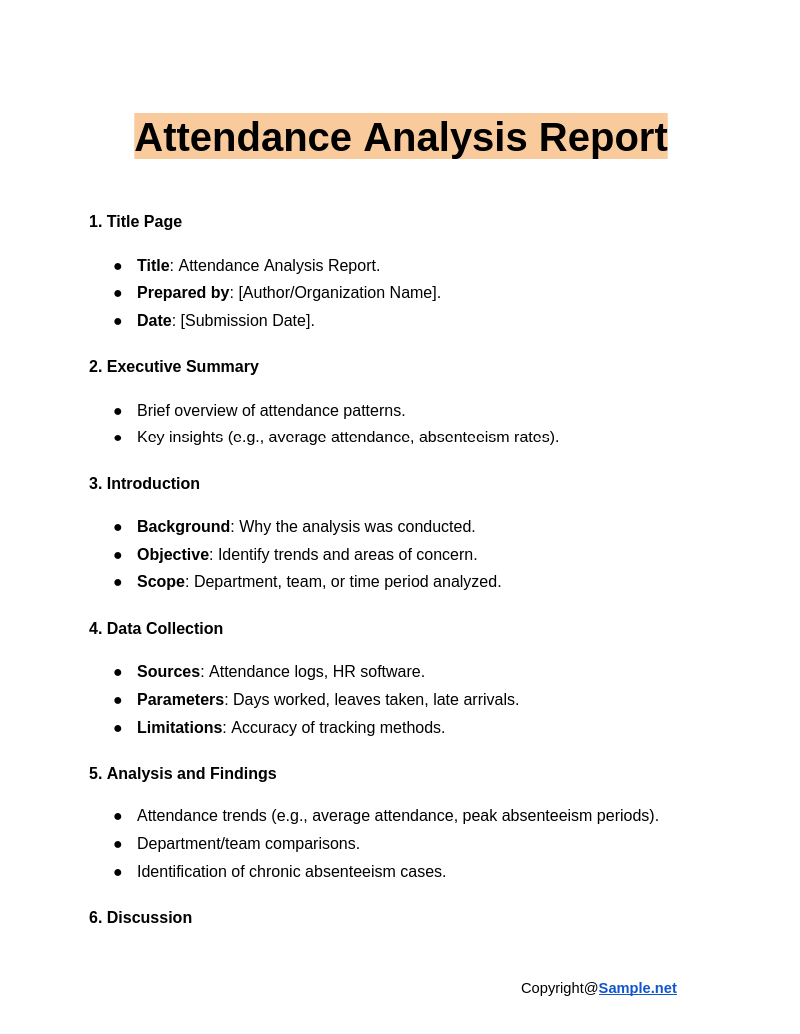
Attendance Analysis Report
download now -
Business Data Analysis Report Template
download now -
Data Analysis Report Template
download now -
Financial Analysis Report Template
download now -
Gap Analysis Report Template
download now -
Strategic Analysis Report Template
download now -
Company Analysis Report Template
download now -

Training Needs Analysis Report Template
download now -
Product Analysis Report Template
download now -
Failure Analysis Report Template
download now -
Marketing Analysis Report Template
download now -
Defect Analysis Report Template
download now -
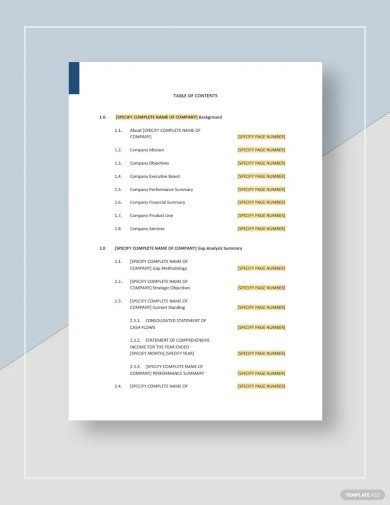
Sample Gap Analysis Report Template
download now -
Cost Analysis Report Template
download now -

Safety Analysis Report Template
download now -

Market Analysis Report Template
download now -
Performance Analysis Report Template
download now -
Competitor Analysis Report Template
download now -
Project Analysis Report Template
download now -
Trend Analysis Report Template
download now -

Sample Business Data Analysis Report Template
download now -
Simple Gap Analysis Report Template
download now -
Sample Marketing Analysis Report Template
download now -
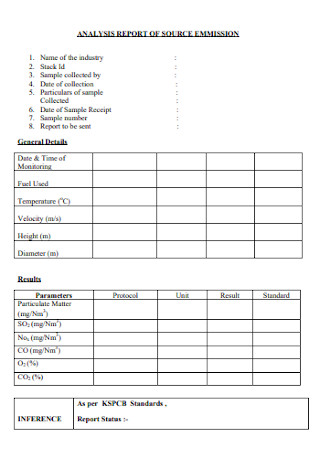
Business Analysis Report of Source Emissions
download now -
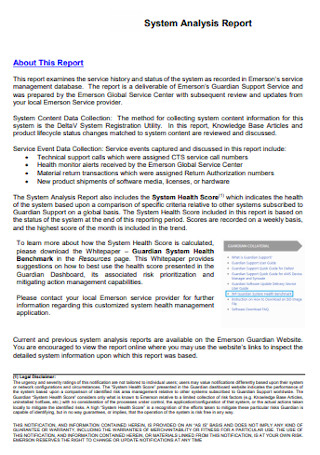
System Writing Analysis Report
download now -
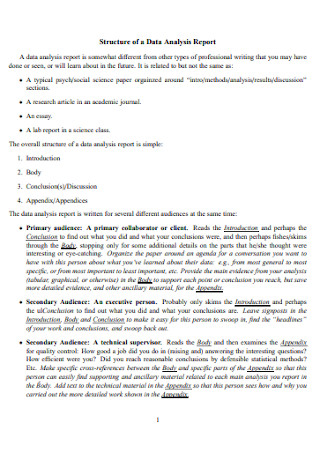
Structure of a Project Data Analysis Report
download now -
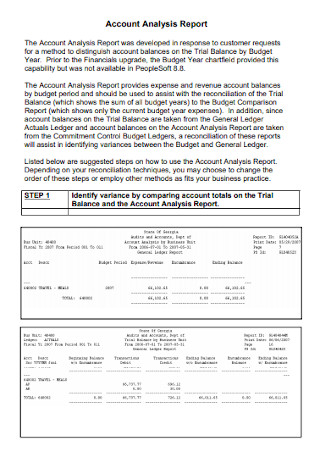
Account Marketing Analysis Report
download now -

Employee Qualitative Data Analysis Report
download now -
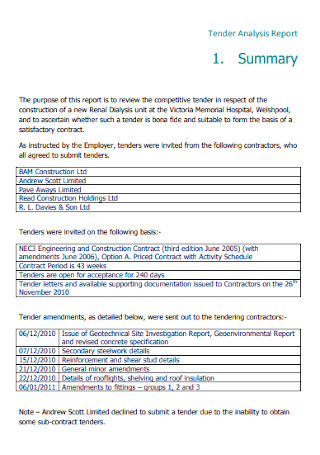
Tender Research Analysis Report
download now -
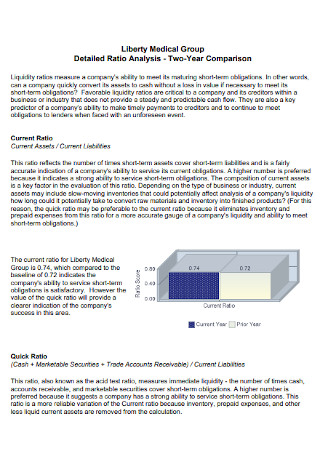
Sample Social Media Financial Analysis Reports
download now -
Job Gap Analysis Report
download now -
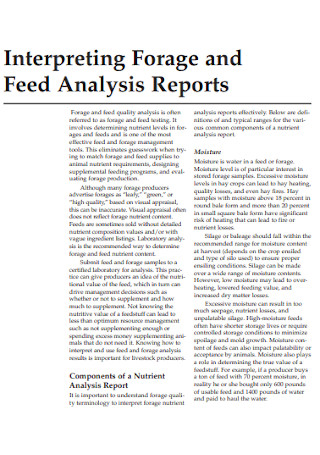
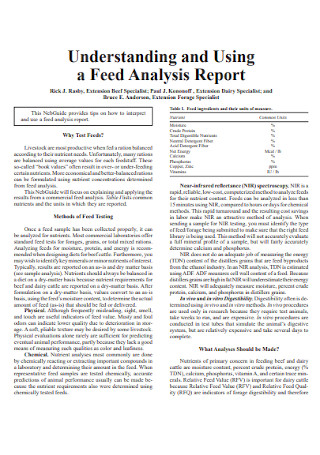
Feed Summary Analysis Reports
download now -
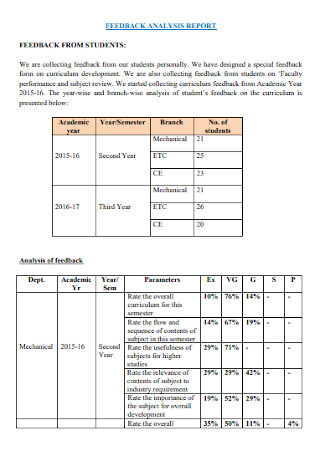
Feedback Website Analysis Report
download now -
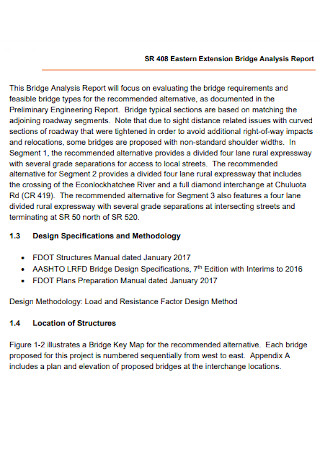
Bridge Monthly Analysis Report
download now -
Root Cause Trend Analysis Report
download now -
Plant Analysis Report
download now -
Market Product Analysis Report
download now -
Student Injury Analysis Report
download now -
Survey Water Analysis Report Template
download now -
Training Crime Needs Analysis Report
download now -
Accounting Impact Analysis Report
download now -
Quality Analysis Report
download now -
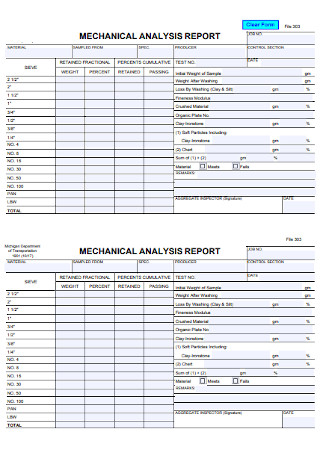
Mechanical Analysis Report Template
download now -
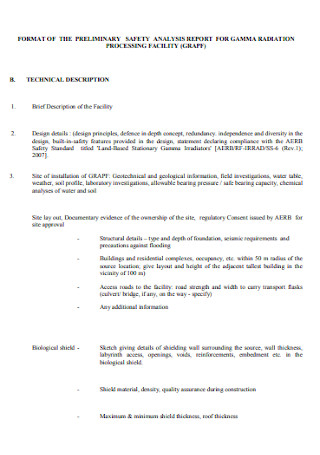
Safety Analysis Report Template
download now -
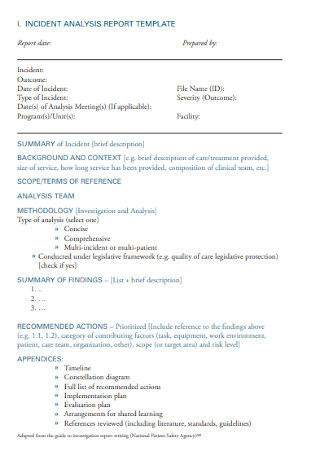
Incident Analysis Report Template
download now -
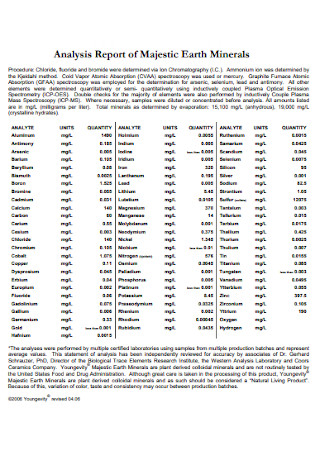
Analysis Report of Majestic Earth Minerals
download now -
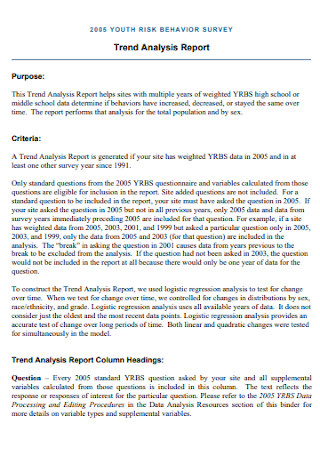
Trend Analysis Report
download now -
Simple Analysis Report Template
download now -
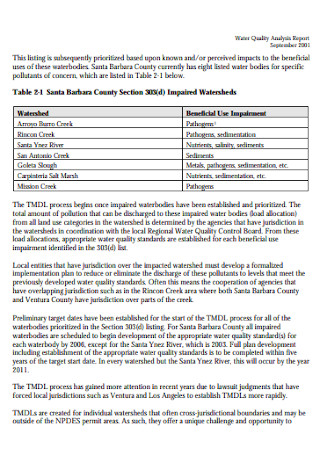
Water Quality Analysis Report
download now -
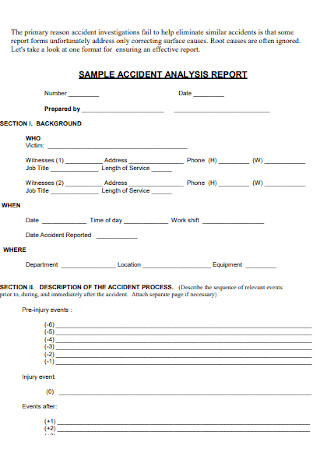
Sample Accident Analysis Report
download now -
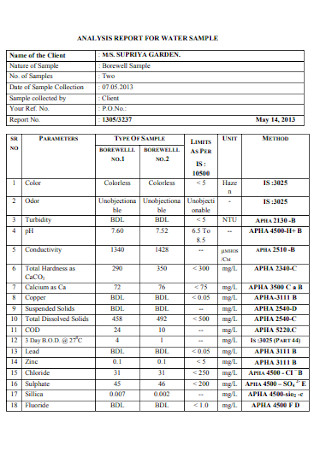
Sample Water Analysis Report Template
download now -
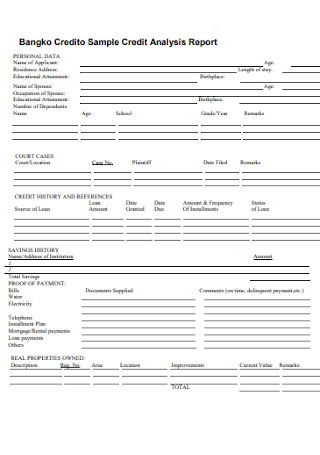
Sample Credit Analysis Report
download now -
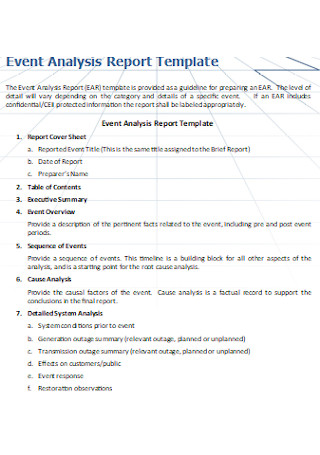
Event Analysis Report
download now -
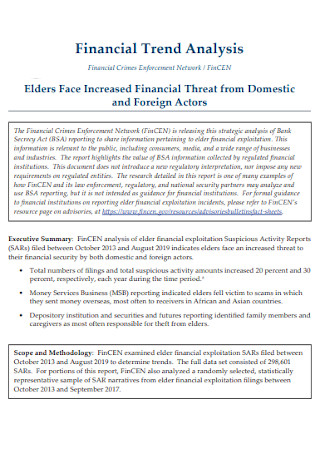
Financial Trend Analysis Report
download now -
Sample Soil Analysis Report
download now
FREE Analysis Report s to Download
Analysis Report Format
Analysis Report Samples
What is an Analysis Report?
Where to Apply Analysis Reports
How to Make an Analysis Report
FAQs
What is the normal process for an analysis report?
What are the types of data analysis?
What is an example of an analysis?
What is the role of visuals in an Analysis Report?
What challenges are faced while creating Analysis Reports?
How can organizations improve the effectiveness of Analysis Reports?
Download Analysis Report Bundle
Analysis Report Format
1. Title Page
- Title of the Report: Clearly state the purpose of the analysis.
- Prepared by: Name of the author or organization.
- Date: Date of report submission.
- Confidentiality: If applicable, include a note regarding confidentiality.
2. Executive Summary
- Brief overview of the report.
- Key findings and conclusions.
- Summary of recommendations.
- Purpose of the analysis.
3. Table of Contents
- List all sections and subsections with corresponding page numbers.
4. Introduction
- Background: Provide context for the report (why the analysis was conducted).
- Objective: Clearly outline the goals of the analysis.
- Scope: Define the boundaries of the analysis (what is included/excluded).
- Methodology: Brief description of the methods, tools, and data used.
5. Data Collection
- Sources of Data: Primary and secondary sources.
- Data Description: Brief overview of the type of data collected.
- Limitations: Acknowledge any limitations or biases in the data.
6. Analysis and Findings
- Approach: Description of analytical methods used (e.g., statistical analysis, qualitative analysis).
- Key Metrics: Define and explain the metrics used for evaluation.
- Findings: Detailed explanation of the results, supported by charts, graphs, and tables.
- Interpretation: Explain what the findings mean in context.
7. Discussion
- Implications: Discuss the significance of the findings.
- Comparisons: Compare with benchmarks, historical data, or similar analyses.
- Trends and Patterns: Highlight any noticeable trends or anomalies.
- Challenges: Mention any issues encountered during the analysis.
8. Recommendations
- Actionable Steps: Specific suggestions based on the findings.
- Impact: Expected outcomes or benefits of the recommended actions.
- Prioritization: Order recommendations by importance or feasibility.
9. Conclusion
- Summarize the main findings.
- Reiterate the importance of the analysis.
- Final thoughts or remarks.
10. References
- List all sources used for data and research.
11. Appendices
- Additional Data: Include raw data, detailed charts, or supplementary materials.
- Technical Details: Methodologies, calculations, or technical notes.
What is an Analysis Report?
In the context of business, there is a report involving quantitative and qualitative data. Data interpretation comes to play here so that the majority can understand any complex data. First of all, analysts are not the only ones who analyze such reports; anyone can interpret quickly with the help of analytical reporting tools. One example is the analysis report. This business report aims to scrutinize, analyze, and evaluate company strategies, processes, and more based on analytic results. Besides statistics, presentations cover various examples, such as historical, predictive, SWOT analysis, and many more.
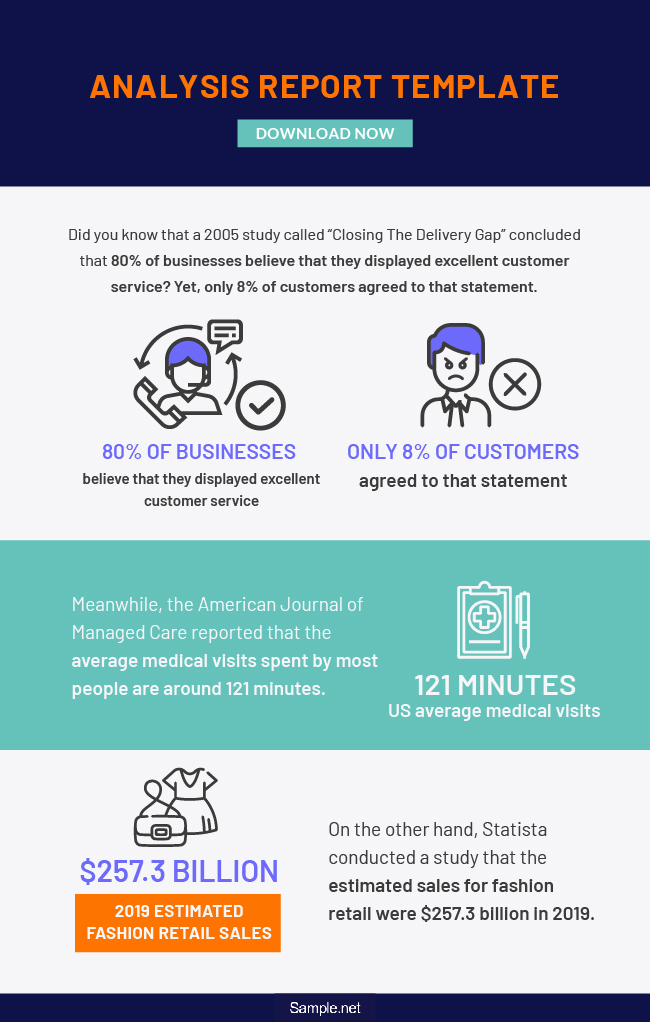
Did you know that a 2005 study called “Closing the Delivery Gap” concluded that 80% of businesses believe that they displayed excellent customer service? Yet, only 8% of customers agreed to that statement.
Meanwhile, the American Journal of Managed Care reported that the average medical visits spent by most people are around 121 minutes.
On the other hand, Statista conducted a study that the estimated sales for fashion retail were $257.3 billion in 2019.
Where to Apply Analysis Reports
As we mentioned before, other industries depend on analytical reports. And it helps to recognize where you can apply that report, so you need not limit using it to one situation only. Plenty of applications is equivalent to plenty of opportunities. Without further ado, here are some examples of where to use your analysis report:
How to Make an Analysis Report
Prioritize effective communication in writing an analytics-style report. While you report, make sure that the audience understands. Clarifying things is necessary, as well. Instead of bringing more questions to raise after the report, keep it to the point where you provide more answers. And how do you create the analysis report? Just follow these simple steps:
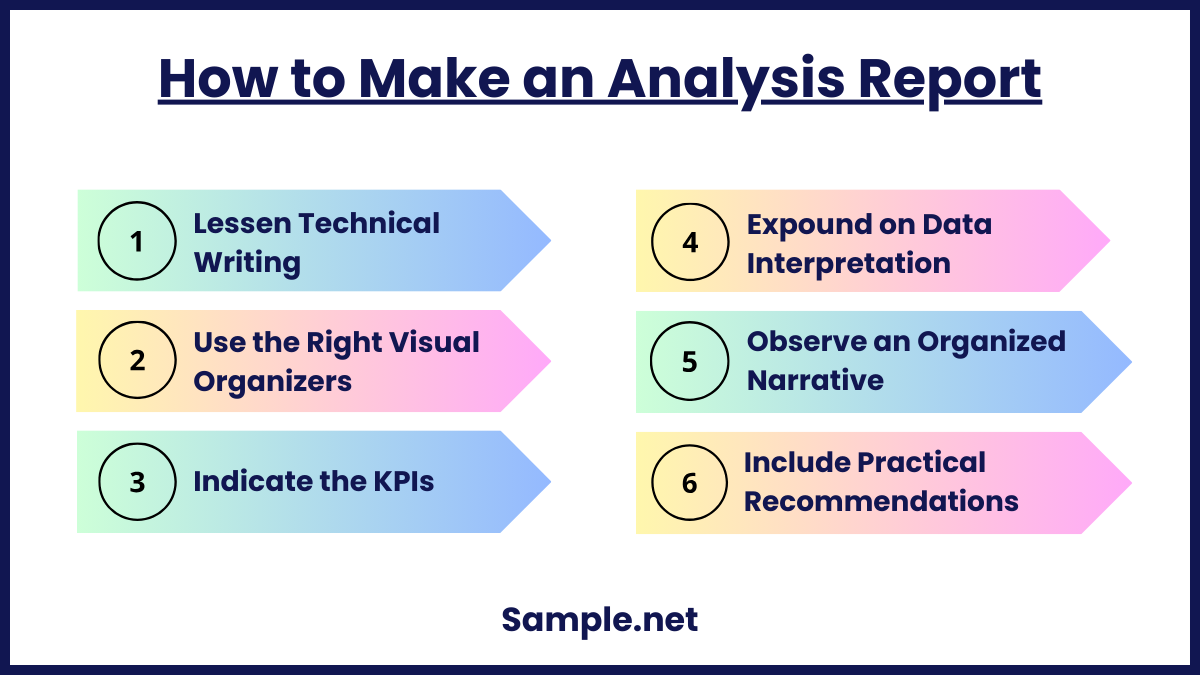
Step 1: Lessen Technical Writing
When writing analytic reports, it is best to write simply. It is a misconception that reports should only provide visual data, graphs, and organizational charts. Words must exist. Presentations tend to have a lot of technical and business terms—aim to lessen it. Using words that are easy to comprehend and brief is welcomed. First, write an introduction by providing a summary of what the whole analysis report is about. This part lets you introduce the report, so audiences receive the gist immediately about the topic to discuss. If you used too many technical terms or flowery words that could be simplified, then simplify those to deliver the message smoothly. You can also see more on Survey Analysis Report.
Step 2: Use the Right Visual Organizers
Of course, analysis reports still include those graphic organizers or infographics for the presentation. However, be sure to use the right tools. Maybe you used the Venn diagram template to showcase statistical data. Venn diagrams are more useful for comparing factors rather than presenting statistics. Thus, a bar graph template would have sufficed than that diagram. Keep in mind that utilizing the wrong tools already indicates that your data interpretation will be doomed. Choose the visuals that are relevant and appropriate instead.
Step 3: Indicate the KPIs
Adding KPIs help everyone understand what aspects were analyzed in the first place. For example, a company that tracks how many visits they receive for their website can make use of visits, new visits, page views, bounce rate, and average time on site for KPIs. What matters is that the appropriate KPIs are present. Furthermore, who you present the report to must understand what every KPI means. Maybe others got confused between two labels of visits. Therefore, clarify that one visit is for the total website visits received while the other one is for the new visits.
Step 4: Expound on Data Interpretation
The critical analysis begins in interpreting and explaining the entire data. Let individuals understand the context. Start by mentioning what legends mean from the symbols and colors used in the chart. Also, this segment is your chance to provide the meat of your report. If people see bar charts from the report, then what? Expound by saying that the monthly sales from the manufacturing business increased or decreased, perhaps. A tip is to input clear descriptions of whatever you did, why, and how it happened. Provide the background and answer the essential questions to complete this.
Step 5: Observe an Organized Narrative
Much like literary analysis, there should be an organized flow to the narrative. Telling a story is another way to explain the analysis report. Following a narrative or plot makes it easy to comprehend since details are well-arranged. In handling this, come up with a sequence regarding what to present first until the last part. There is no need to keep the report poetic, though. Just observe a flow by adapting storytelling to develop a more effective output.
Step 6: Include Practical Recommendations
As you present the results and data, never simply end there. Give beneficial suggestions that help the industry. If sales are down, then what could be the best solution to boost it next time? The point is not to repeat every failure that happens. And if the results are positive, aim to maintain it. But make sure to measure the impact of the result to the recommendation. Otherwise, you might end up using useless solutions that could not change the data for the better. You can also see more on Job Analysis Reports.
FAQs
What is the normal process for an analysis report?
Data analysis reports, done by most analysts, consist of five steps. Begin with defining the questions. Those will eventually be answered in the report. Next, prepare measurement priorities. That segment contains KPIs, goals, and objectives. Third, gather the data which should be analyzed. Thus, analyzing such data marks as the fourth step. Lastly, interpret the results which conclude the report.
What are the types of data analysis?
Mainly, there are four types of data analysis. They are the descriptive, diagnostic, predictive, and prescriptive analysis. Each example contains unique features that will help you come up with an efficient report. Learn their differences and use them in the right applications.
What is an example of an analysis?
The analysis breaks down a particular subject into specific components. And you eventually discover what each element does or how they are related to each other. One typical example of that is analyzing the effects of supply and demand in a logistics important business document.
What is the role of visuals in an Analysis Report?
Visuals such as graphs, charts, and tables simplify complex data and enhance understanding. They allow readers to identify patterns and trends quickly without going through extensive text. For example, a pie chart can illustrate market share distribution effectively. Including visuals makes the report more engaging and ensures key insights are communicated clearly. Visuals are an essential component of professional and impactful reports.
What challenges are faced while creating Analysis Reports?
Common challenges include data inaccuracies, insufficient data, or bias in interpretation. Poor structuring or lack of clear objectives can also reduce the report’s effectiveness. Overcoming these challenges requires using reliable data sources, employing proper analytical tools, and following a clear, structured approach. Addressing these issues ensures that the report delivers accurate and actionable insights.
How can organizations improve the effectiveness of Analysis Reports?
Organizations can improve effectiveness by ensuring clarity, accuracy, and relevance. Clear objectives, accurate data collection, and structured analysis are key to achieving this. Engaging stakeholders in the process and using real-world examples also adds value. Reviewing and refining the report based on feedback enhances its quality. Ultimately, consistent efforts to improve the process will maximize the report’s impact. You can also see more on Industry Analysis.