13+ Sample Sales Business Report
-
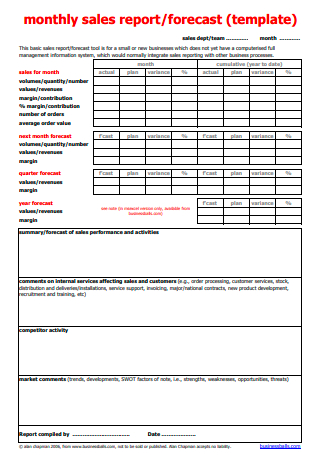
Monthly Sales Business Report Template
download now -
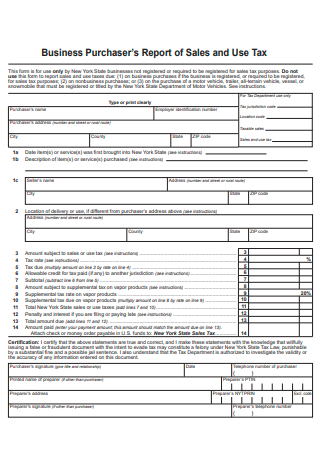
Business Purchaser Report of Sales
download now -
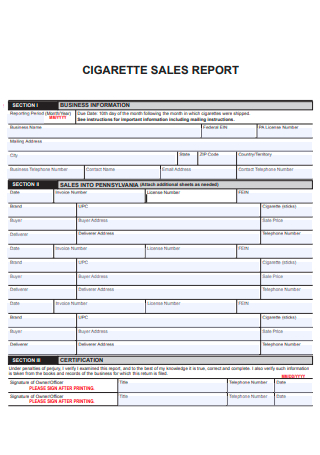
Cigarette Sales Business Report
download now -
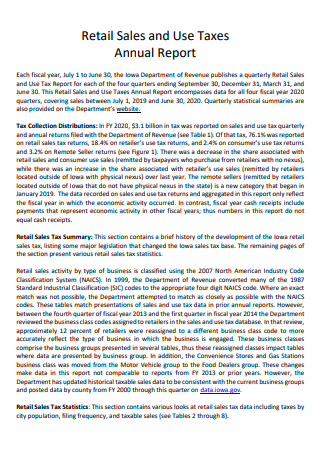
Retail Sales and Taxes Business Annual Report
download now -
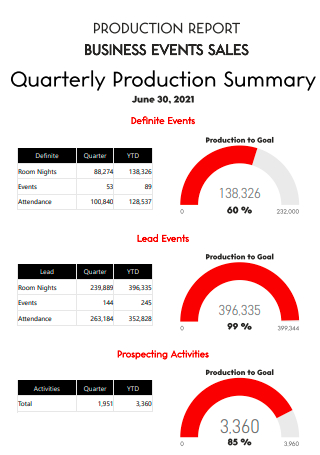
Sales Business Events Production Report
download now -
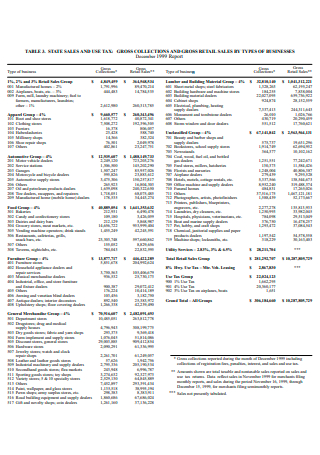
Sales Business Report in PDF
download now -
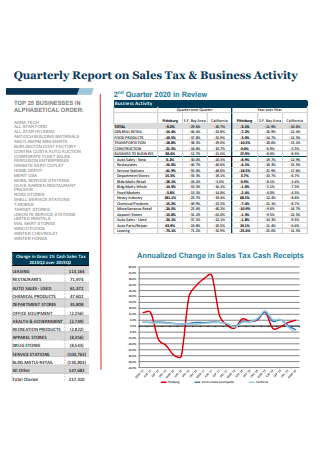
Sales Tax and Business Activity Quarterly Report
download now -
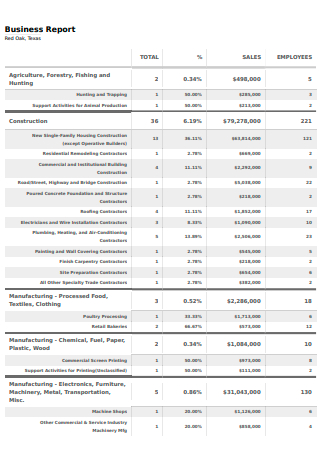
Basic Sales Business Report
download now -
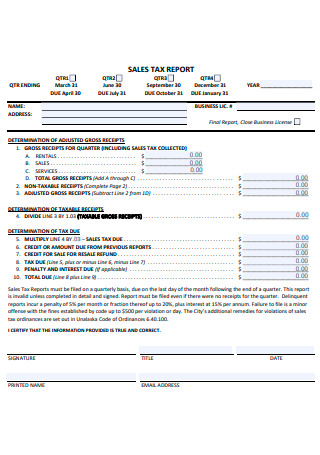
Sales Business Tax Report
download now -
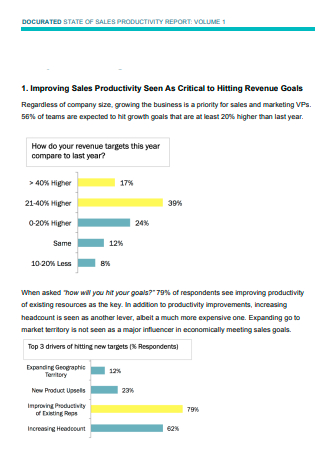
Sales Business Productivity Report
download now -
Yearly Sales Business Report
download now -
Sales Operations Business Report
download now -
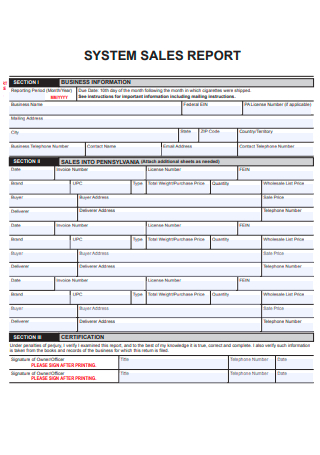
System Sales Business Report
download now -
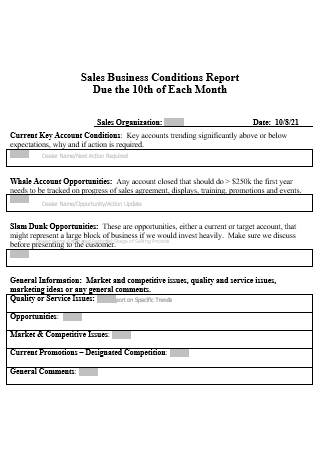
Sales Business Conditions Report
download now
FREE Sales Business Report s to Download
13+ Sample Sales Business Report
a Sales Business Report?
Benefits of a Sales Business Report
Types of Sales in a Business
How To Write a Sales Business Report
FAQs
Why is it vital to monitor daily, weekly, and monthly sales reports?
What information does a sales report contain?
Why is reporting critical for business?
What Is a Sales Business Report?
A sales business report, alternatively referred to as a sales analysis report, is a document that summarizes the sales activities of a business. Typically, this report includes data on sales volume, leads, new accounts, revenue, and costs for a specified time. Also, it can analyze this data at each stage of the sales funnel and provide insight into the performance of your sales team. These reports may assist your business in modifying its sales strategy and other growth initiatives. They can provide insight into the success of sales methodologies, forecasting future sales data, performance comparisons to prior periods, and a better understanding of customer motivations. According to research, 91 percent of organizations have sales data inaccuracies, resulting in an average revenue loss of 12 percent. Ascertain the accuracy of your sales data, as its absence will undoubtedly affect your analysis and reporting.
Benefits of a Sales Business Report
Businesses have recognized that sales business reports enable them to better understand their workforce’s challenges and suggest real-time corrective measures. However, this is a pointless activity from the salesperson’s perspective – even more so when there is no genuine update to share. On the other hand, managers should be aware of daily team updates to make informed decisions about how and where to focus their time and resources. Also, automating the process of creating daily sales reports reduces the amount of work required. Numerous organizations utilize sales CRM software that automatically generates sales reports based on business KPIs without requiring users to take any action. The following are a few ways that sales business reports can help you improve your business’s sales performance and growth.
Types of Sales in a Business
A sales job is the most prevalent and one of the most rewarding careers pursued by nearly everyone. The fundamental premise is that the seller provides services and goods in exchange for money from the buyer. There are numerous job openings in the sales profile, as there are multiple sales based on the nature of the transaction and business conducted. There are various forms of sales, depending on the nature of the firm and the clients. The following are a few significant sorts of sales that are prevalent in the majority of organizations:
Inside Sales
A salesman is frequently referred to as a sales representative because they are responsible for maintaining relationships with current clients and generating new sales orders. Inside sales representatives perform the same function. The salesperson is the main point of connection for clients. The representative’s primary responsibility is to grow the business by developing good relationships with clients.
Outside Sales
This is the form of sale that is referred to as conventional. The representative communicates with consumers face to face and works primarily outside the office. Representatives spend more time in clients’ offices than in their own, as interaction generates business. A salesperson must be self-motivated and goal-oriented to succeed at outside sales by meeting targets with little or no supervision.
Sales support function
Because team-based sales operations are becoming more prevalent in every firm, sales assistance entails what the label implies: the individual is required to assist field-based salespeople. These support functions work behind the scenes to help these representatives in concluding the deal. Support functions may include collecting checks or payments, creating new accounts for customers, generating daily reports on sales targets achieved, directing further customer inquiries to the appropriate sales representative, etc. This support function arm benefits the firm by reducing the salesperson’s time and focusing on other clients on a shoestring budget.
Client Services
Client service representatives are responsible for assisting customers and ensuring that their requirements and expectations are met. They are accountable for developing and maintaining positive business relationships with clients through servicing operations. They guarantee customer satisfaction and the retention of existing clients, and the acquisition of new ones. The client servicing team’s primary purpose is to earn repeat orders from existing customers by maintaining a positive relationship.
How To Write a Sales Business Report
This is why sales company reports are critical to the success of any organization. They provide a clear picture of what is and is not working, enabling you to make more informed business decisions and optimize your sales plan and strategy. Apart from reaching targets, sales managers are expected to prepare and submit reports to senior management and stakeholders, providing a comprehensive view of sales activity. Consider the following strategies for writing great sales business reports that provide accurate insights while maintaining reader engagement and interest:
Step 1: Determine the appearance of your sales business report.
A sales business report should be more than a collection of facts and figures. Additionally, it should be visually appealing and easy to read without feeling overloaded. This can be accomplished by downloading a sales report template or utilizing your customer relationship management (CRM) software, enabling the easy development of various report kinds.
Step 2: Take into account your audience and include the necessary facts.
If you’re a senior member of the sales team reporting to the head of sales, you may wish to include many KPIs. Executives may prefer a more concise summary. Additionally, a CEO may have a distinct set of data requirements than a CFO. Your CRM software should be capable of assisting you with the reformatting of your sales data for any audience. After determining your audience and the level of reporting required, you can decide whether or not to include or exclude specific data sets, such as sales revenue and costs, period-to-period KPI change, progress toward sales goals, sales by product or service, sales forecasts, and future sales plans.
Step 3: Establish your current and past periods and compile data following that.
Given the frequency above criteria, you should decide whether the information you wish to transmit is best presented in a yearly, monthly, weekly, or daily view. You should then compare your data for this period to data from a comparable preceding period. Once you’ve determined your information requirements and data collection timeframe, it’s time to begin compiling your data. This stage entails typically logging into your CRM software and retrieving data, which may then be exported to another program or transformed into reports directly from your CRM dashboard. In either case, sales business reporting is not limited to centralizing your data.
Step 4: suitably present your data.
Sales company reports need not be merely numerical summaries. You should add numerous graphs and other illustrative pictures to assist your audience in comprehending these figures. Of course, you should choose the appropriate graph type. For instance, an annual report may include a line chart to illustrate monthly revenue growth. Your CRM program may generate these charts automatically, or you can utilize Excel to aid you in creating graphs.
Step 5: Verify and explain your data and information.
Following the compilation of data and the creation of charts and graphs, you should return to stages one and two: assessing your audience and providing pertinent information. Occasionally, you will not realize you have included too much or too little material until after you have completed the initial draft of a report. Do not be hesitant to delete information, rebuild graphs, or seek assistance from a fellow sales team member. Bear in mind that everyone requires an editor. It’s critical to create a balance between insight and excess well in advance of your meeting. Lastly, explain your data. Remember that displaying data is only half the battle; you must also give your data context to make sense to your audience. Your written explanations should simultaneously justify and justify your figures. They should also detail the corrections that your team intends to make. For instance, if a key competitor’s limited-time discounts have resulted in a decrease in your sales, describe how you intend to reclaim the clients lost as a result of the promotion. Even the most alarming data can be presented meaningfully if an actionable, fixable root cause is identified. Once you take action, your sales may grow. This is where the sales business report’s value lies.
FAQs
Why is it vital to monitor daily, weekly, and monthly sales reports?
Daily, weekly, and monthly sales activity reporting each serves a distinct purpose. Daily sales reports provide insight into a sales representative’s/daily agent’s operations, allowing you to detect operational bottlenecks or other roadblocks along the way. Weekly sales reports can assist managers in tracking the number of deals closed or money earned by their team. Monthly sales reports paint a complete picture of sales activity, sales rep performance, and team performance.
What information does a sales report contain?
A typical sales report should include key performance indicators (KPIs), the number of goods sold, net revenues, earnings, and customer acquisition expenses. Depending on your qualifications, you may wish to integrate additional indicators such as sales growth, regional sales, new opportunities, team performance, and others.
Why is reporting critical for business?
Business reports give managers valuable insights, such as data on spending, earnings, and growth. Reports will contain critical information that can assist in developing future predictions, marketing plans, budget planning, and decision-making.
Sales business reports are critical decision-making tools that guide your team on the proper path and motivate them to perform. On the other hand, reports have a terrible reputation for being dry and uninteresting, but this does not have to be the case. You may write reports that effectively communicate your message while maintaining the audience’s engagement and attention. Apart from developing well-structured, factual reports, it’s critical to guarantee they’re easy to read by presenting your sales data and analysis in novel ways.
